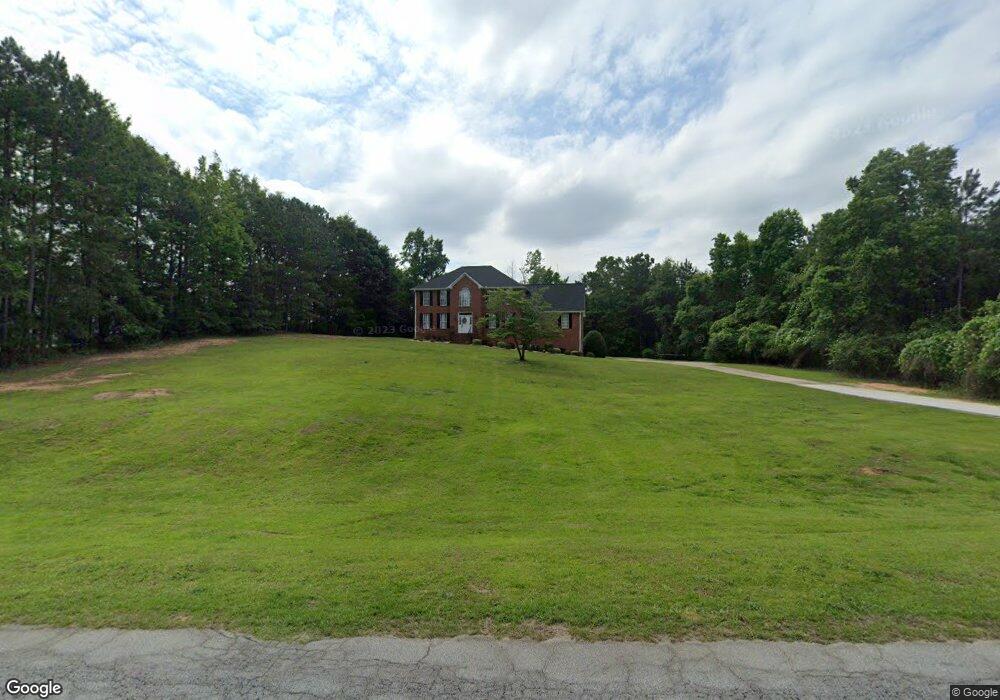
136 Gates Rd Unit 200-d Lizella, GA 31052
Estimated Value: $387,645 - $440,000
4
Beds
4
Baths
3,387
Sq Ft
$124/Sq Ft
Est. Value
About This Home
This home is located at 136 Gates Rd Unit 200-d, Lizella, GA 31052 and is currently estimated at $420,911, approximately $124 per square foot. 136 Gates Rd Unit 200-d is a home located in Bibb County with nearby schools including Skyview Elementary School, Rutland Middle School, and Rutland High School.
Ownership History
Date
Name
Owned For
Owner Type
Purchase Details
Closed on
Mar 22, 2019
Sold by
Sai Real Estate Holdings Llc
Bought by
Angel Angelica
Current Estimated Value
Home Financials for this Owner
Home Financials are based on the most recent Mortgage that was taken out on this home.
Original Mortgage
$199,800
Outstanding Balance
$175,300
Interest Rate
4.3%
Mortgage Type
New Conventional
Estimated Equity
$245,611
Purchase Details
Closed on
Nov 4, 2010
Sold by
Federal National Mortgage Association
Bought by
Sai Real Estate Holdings Llc
Purchase Details
Closed on
Jan 5, 2010
Sold by
Chase Home Finance Llc
Bought by
Federal National Mortgage Association
Purchase Details
Closed on
Sep 30, 2003
Bought by
Oliver Eugenia
Create a Home Valuation Report for This Property
The Home Valuation Report is an in-depth analysis detailing your home's value as well as a comparison with similar homes in the area
Home Values in the Area
Average Home Value in this Area
Purchase History
| Date | Buyer | Sale Price | Title Company |
|---|---|---|---|
| Angel Angelica | $222,000 | None Available | |
| Sai Real Estate Holdings Llc | $160,650 | None Available | |
| Federal National Mortgage Association | $220,100 | -- | |
| Federal National Mortgage Association | $220,071 | None Available | |
| Chase Home Finance Llc | $220,071 | None Available | |
| Oliver Eugenia | $236,000 | -- |
Source: Public Records
Mortgage History
| Date | Status | Borrower | Loan Amount |
|---|---|---|---|
| Open | Angel Angelica | $199,800 |
Source: Public Records
Tax History Compared to Growth
Tax History
| Year | Tax Paid | Tax Assessment Tax Assessment Total Assessment is a certain percentage of the fair market value that is determined by local assessors to be the total taxable value of land and additions on the property. | Land | Improvement |
|---|---|---|---|---|
| 2024 | $3,247 | $127,843 | $9,508 | $118,335 |
| 2023 | $3,247 | $127,843 | $9,508 | $118,335 |
| 2022 | $3,701 | $106,894 | $12,640 | $94,254 |
| 2021 | $3,346 | $88,043 | $12,640 | $75,403 |
| 2020 | $3,418 | $88,043 | $12,640 | $75,403 |
| 2019 | $3,446 | $88,043 | $12,640 | $75,403 |
| 2018 | $5,480 | $88,412 | $12,640 | $75,772 |
| 2017 | $3,312 | $88,412 | $12,640 | $75,772 |
| 2016 | $3,059 | $88,412 | $12,640 | $75,772 |
| 2015 | $5,262 | $107,452 | $12,640 | $94,811 |
| 2014 | $1,820 | $111,333 | $16,522 | $94,811 |
Source: Public Records
Map
Nearby Homes
- 157 Gates Rd
- 159 Gates Rd
- 151 Gates Rd
- 200 Sailwind Ct
- 324 Old Mast Cove
- 313 Old Mast Cove
- 309 Old Mast Cove
- 305 Old Mast Cove
- 112 Waters Pointe
- 116 Waters Pointe
- 132 Waters Pointe
- 160 Waters Pointe
- 164 Waters Pointe
- 168 Waters Pointe
- 101 Waters Pointe
- 417 Lake Waters Pointe
- 417 Lake Water Pointe
- 416 Lake Water Pointe