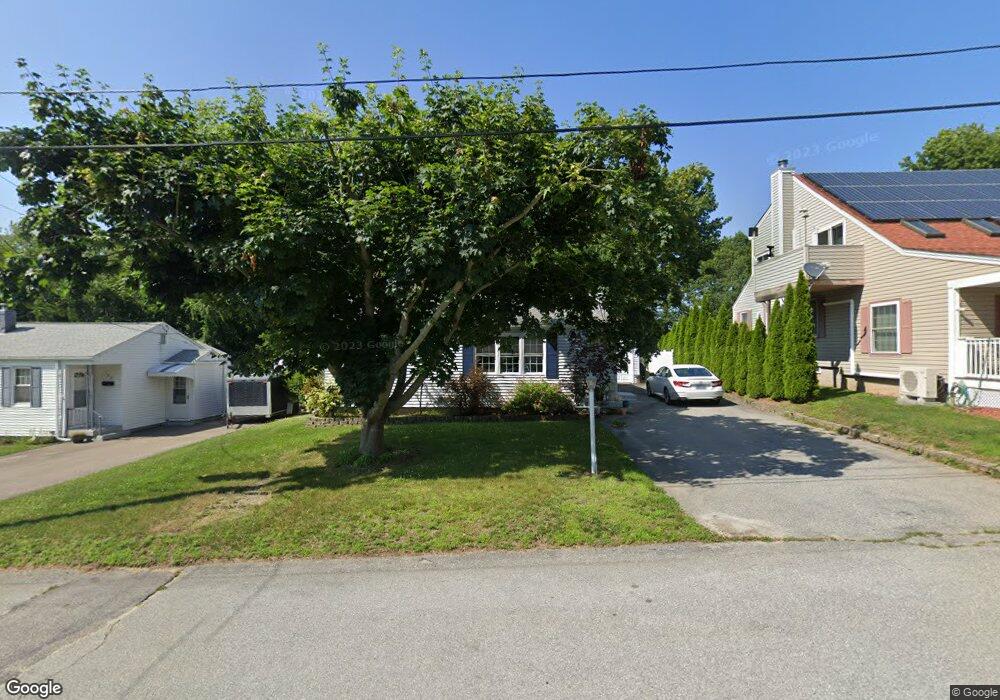
136 Hambly Rd Tiverton, RI 02878
North Tiverton NeighborhoodEstimated Value: $439,553 - $512,000
3
Beds
2
Baths
1,240
Sq Ft
$382/Sq Ft
Est. Value
About This Home
This home is located at 136 Hambly Rd, Tiverton, RI 02878 and is currently estimated at $473,888, approximately $382 per square foot. 136 Hambly Rd is a home located in Newport County with nearby schools including Tiverton High School, Argosy Collegiate Charter School, and Saint Stanislaus School.
Ownership History
Date
Name
Owned For
Owner Type
Purchase Details
Closed on
Sep 12, 2018
Sold by
Marino Beverly A
Bought by
Beverly A Marino Ret
Current Estimated Value
Purchase Details
Closed on
Oct 20, 2011
Sold by
Holhan Helyn S
Bought by
Marino Gary A and Marino Beverly A
Home Financials for this Owner
Home Financials are based on the most recent Mortgage that was taken out on this home.
Original Mortgage
$55,000
Interest Rate
4.08%
Create a Home Valuation Report for This Property
The Home Valuation Report is an in-depth analysis detailing your home's value as well as a comparison with similar homes in the area
Home Values in the Area
Average Home Value in this Area
Purchase History
| Date | Buyer | Sale Price | Title Company |
|---|---|---|---|
| Beverly A Marino Ret | -- | -- | |
| Marino Gary A | $5,000 | -- |
Source: Public Records
Mortgage History
| Date | Status | Borrower | Loan Amount |
|---|---|---|---|
| Previous Owner | Marino Gary A | $100,000 | |
| Previous Owner | Marino Gary A | $55,000 |
Source: Public Records
Tax History Compared to Growth
Tax History
| Year | Tax Paid | Tax Assessment Tax Assessment Total Assessment is a certain percentage of the fair market value that is determined by local assessors to be the total taxable value of land and additions on the property. | Land | Improvement |
|---|---|---|---|---|
| 2025 | $3,748 | $339,200 | $114,800 | $224,400 |
| 2024 | $3,748 | $339,200 | $114,800 | $224,400 |
| 2023 | $3,974 | $266,700 | $105,200 | $161,500 |
| 2022 | $3,902 | $266,700 | $105,200 | $161,500 |
| 2021 | $3,806 | $266,700 | $105,200 | $161,500 |
| 2020 | $3,790 | $234,100 | $78,300 | $155,800 |
| 2019 | $3,696 | $234,100 | $78,300 | $155,800 |
| 2018 | $3,837 | $234,100 | $78,300 | $155,800 |
| 2017 | $3,435 | $180,300 | $75,800 | $104,500 |
| 2016 | $3,451 | $180,300 | $75,800 | $104,500 |
| 2015 | $3,451 | $180,300 | $75,800 | $104,500 |
| 2014 | $3,476 | $180,100 | $72,800 | $107,300 |
Source: Public Records
Map
Nearby Homes