Estimated Value: $141,955 - $261,000
--
Bed
1
Bath
--
Sq Ft
7.27
Acres
About This Home
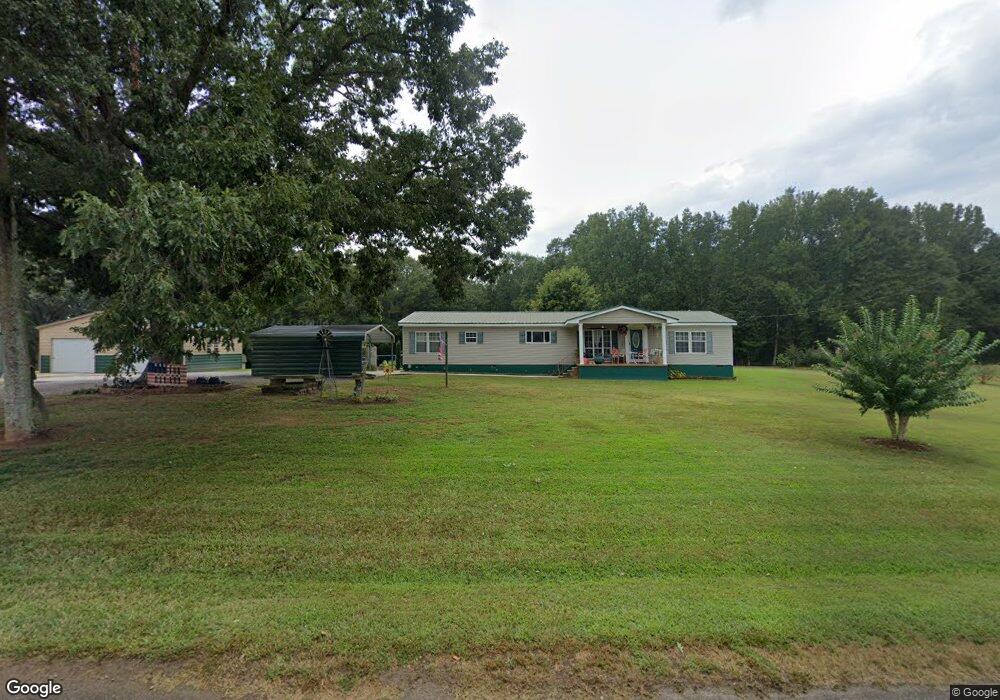
This home is located at 136 Joe Johnson Rd, Canon, GA 30520 and is currently estimated at $216,985. 136 Joe Johnson Rd is a home located in Hart County with nearby schools including Hart County High School, Goldmine Christian Academy, and Cherokee Rose Elementary School.
Ownership History
Date
Name
Owned For
Owner Type
Purchase Details
Closed on
Dec 1, 1997
Current Estimated Value
Purchase Details
Closed on
Feb 1, 1953
Create a Home Valuation Report for This Property
The Home Valuation Report is an in-depth analysis detailing your home's value as well as a comparison with similar homes in the area
Home Values in the Area
Average Home Value in this Area
Purchase History
| Date | Buyer | Sale Price | Title Company |
|---|---|---|---|
| -- | -- | -- | |
| -- | $36,500 | -- | |
| -- | -- | -- |
Source: Public Records
Tax History Compared to Growth
Tax History
| Year | Tax Paid | Tax Assessment Tax Assessment Total Assessment is a certain percentage of the fair market value that is determined by local assessors to be the total taxable value of land and additions on the property. | Land | Improvement |
|---|---|---|---|---|
| 2024 | $595 | $38,514 | $32,474 | $6,040 |
| 2023 | $534 | $32,044 | $26,004 | $6,040 |
| 2022 | $509 | $30,588 | $25,488 | $5,100 |
| 2021 | $421 | $22,712 | $17,630 | $5,082 |
| 2020 | $431 | $22,247 | $17,165 | $5,082 |
| 2019 | $438 | $22,427 | $17,165 | $5,262 |
| 2018 | $451 | $22,788 | $17,165 | $5,623 |
| 2017 | $453 | $22,788 | $17,165 | $5,623 |
| 2016 | $374 | $18,242 | $12,439 | $5,803 |
| 2015 | $412 | $21,166 | $15,183 | $5,983 |
| 2014 | $338 | $17,004 | $10,840 | $6,164 |
| 2013 | -- | $25,951 | $10,840 | $15,111 |
Source: Public Records
Map
Nearby Homes
- 2629 Bethany Bowersville Rd Unit 4
- 2645 Bethany Bowersville Rd Unit 3
- 2651 Bethany Bowersville Rd Unit 2
- 2667 Bethany Bowersville Rd Unit 35
- 2667 Bethany Bowersville Rd Unit 1
- 0 Kesler Rd Unit 10586025
- 5041 Airline-Goldmine Rd
- 835 Center of the World Rd
- 173 Hendry Church Rd
- 744 Cherokee Ridge Rd
- TRACT 6 Seed Cleaner Rd
- TRACT 5 Seed Cleaner Rd
- TRACT 4 Seed Cleaner Rd
- TRACT 3 Seed Cleaner Rd
- TRACT 2 Seed Cleaner Rd
- TRACT 1 Seed Cleaner Rd
- 3465 Georgia 51
- 782 Sunset Rd
- 869 Ankerich Rd
- TRACT 4 Friendship Rd
- 0 Kesler Rd N Joe Johnson Rd Unit 9024175
- 2020 Kesler Rd
- 1984 Kesler Rd
- 1984 Kesler Rd
- 1974 Kesler Rd
- 213 Joe Johnson Rd
- 0 Frank Crook Rd
- 0 Frank Crook Rd Unit 20014168
- 0 Frank Crook Rd Unit 3237346
- 300 Joe Johnson Rd
- 1521 Frank Crook Rd
- 2203 Kesler Rd
- 390 Joe Johnson Rd
- 403 Joe Johnson Rd
- 1858 Kesler Rd
- 1744 Kesler Rd
- 318 Bethany Ln
- 544 Joe Johnson Rd
- 270 Bethany Ln
- 2343 Bethany Bowersville Rd