136 Kent Ave Suffield, CT 06078
Suffield AreaEstimated Value: $274,711 - $319,000
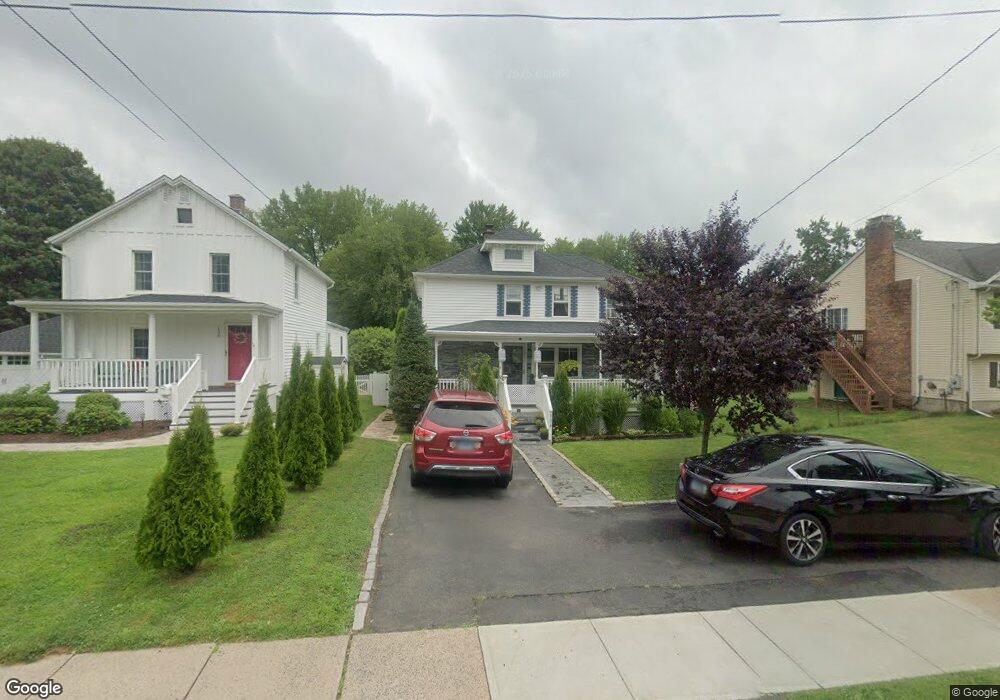
About This Home
This home is located at 136 Kent Ave, Suffield, CT 06078 and is currently estimated at $304,178, approximately $282 per square foot. 136 Kent Ave is a home located in Hartford County with nearby schools including A. Ward Spaulding School, Mcalister Intermediate School, and Suffield Middle School.
Ownership History
We collect this data history from publicly available records. To have your information removed, we recommend requesting removal directly through your county’s website.
Purchase Details
Home Financials for this Owner
Home Financials are based on the most recent Mortgage that was taken out on this home.Purchase Details
Home Values in the Area
Average Home Value in this Area
Purchase History
We collect this data history from publicly available records. To have your information removed, we recommend requesting removal directly through your county’s website.
| Date | Buyer | Sale Price | Title Company |
|---|---|---|---|
| $177,000 | -- | ||
| $68,000 | -- |
Mortgage History
We collect this data history from publicly available records. To have your information removed, we recommend requesting removal directly through your county’s website.
| Date | Status | Borrower | Loan Amount |
|---|---|---|---|
| Open | $9,400 |
Tax History
We collect this data history from publicly available records. To have your information removed, we recommend requesting removal directly through your county’s website.
| Year | Tax Paid | Tax Assessment Tax Assessment Total Assessment is a certain percentage of the fair market value that is determined by local assessors to be the total taxable value of land and additions on the property. | Land | Improvement |
|---|---|---|---|---|
| 2025 | $3,418 | $146,020 | $37,800 | $108,220 |
| 2024 | $3,304 | $146,020 | $37,800 | $108,220 |
| 2023 | $3,014 | $105,350 | $38,080 | $67,270 |
| 2022 | $3,014 | $105,350 | $38,080 | $67,270 |
| 2021 | $3,017 | $105,350 | $38,080 | $67,270 |
| 2020 | $3,017 | $105,350 | $38,080 | $67,270 |
| 2019 | $3,026 | $105,350 | $38,080 | $67,270 |
| 2018 | $3,230 | $110,180 | $39,060 | $71,120 |
| 2017 | $3,183 | $110,180 | $39,060 | $71,120 |
| 2016 | $3,107 | $110,180 | $39,060 | $71,120 |
| 2015 | $3,061 | $110,180 | $39,060 | $71,120 |
| 2014 | $2,988 | $110,180 | $39,060 | $71,120 |
Map
- 0 Stone St S Unit 24039713
- 392 Boston Neck Rd
- 48 Brandywine Ln Unit 48
- 31 Gooseberry Dr
- 81 Brandywine Ln Unit 81
- 625 Mather St
- 500 Thrall Ave
- 281 N Main St
- 371 N Main St
- 4 Arbor Way
- 551 N Main St
- 320 Mapleton Ave
- 0 Hale St Unit 96
- 763 North St
- 278 Thompsonville Rd
- 310 Thompsonville Rd
- 8 Greendale Dr Unit 8
- 31 Ross Way Unit 31
- 98 1st St
- 1485 Suffield St
Ask me questions while you tour the home.