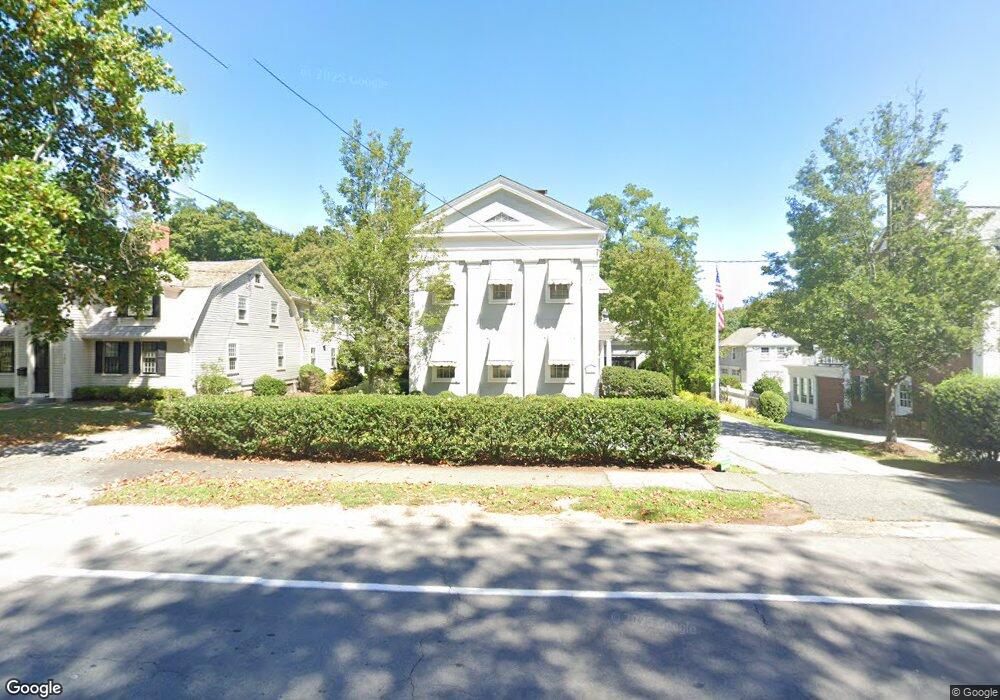
136 Main St Hingham, MA 02043
Estimated Value: $2,073,000 - $2,628,000
4
Beds
4
Baths
3,308
Sq Ft
$707/Sq Ft
Est. Value
About This Home
This home is located at 136 Main St, Hingham, MA 02043 and is currently estimated at $2,339,730, approximately $707 per square foot. 136 Main St is a home located in Plymouth County with nearby schools including East Elementary School, Hingham Middle School, and Hingham High School.
Ownership History
Date
Name
Owned For
Owner Type
Purchase Details
Closed on
Nov 16, 2018
Sold by
2014 Irt
Bought by
Vaughan Ft 2018
Current Estimated Value
Purchase Details
Closed on
Aug 21, 2014
Sold by
Vaughan 3Rd James D
Bought by
Vaughan Ft
Purchase Details
Closed on
Jan 19, 2006
Sold by
Daniels Richard J and Daniels Mary A
Bought by
Vaughan Tr Lois M and Vaughan James D
Purchase Details
Closed on
Oct 31, 2002
Sold by
Hubbell Constance N
Bought by
Daniels Richard J and Daniels Mary A
Purchase Details
Closed on
Dec 1, 1998
Sold by
Pelissier Warren E
Bought by
Hubbell Constancae N
Purchase Details
Closed on
Aug 5, 1993
Sold by
Paxton Mary B
Bought by
Pelissier Warren E
Create a Home Valuation Report for This Property
The Home Valuation Report is an in-depth analysis detailing your home's value as well as a comparison with similar homes in the area
Purchase History
| Date | Buyer | Sale Price | Title Company |
|---|---|---|---|
| Vaughan Ft 2018 | -- | -- | |
| Vaughan Ft | -- | -- | |
| Vaughan 3Rd James D | -- | -- | |
| Vaughan Tr Lois M | $1,595,000 | -- | |
| Daniels Richard J | $1,275,000 | -- | |
| Hubbell Constancae N | $752,000 | -- | |
| Pelissier Warren E | $340,000 | -- |
Source: Public Records
Mortgage History
| Date | Status | Borrower | Loan Amount |
|---|---|---|---|
| Previous Owner | Pelissier Warren E | $250,000 | |
| Previous Owner | Pelissier Warren E | $695,300 |
Source: Public Records
Tax History
| Year | Tax Paid | Tax Assessment Tax Assessment Total Assessment is a certain percentage of the fair market value that is determined by local assessors to be the total taxable value of land and additions on the property. | Land | Improvement |
|---|---|---|---|---|
| 2025 | $21,580 | $2,018,700 | $750,900 | $1,267,800 |
| 2024 | $21,601 | $1,990,900 | $750,900 | $1,240,000 |
| 2023 | $19,519 | $1,951,900 | $750,900 | $1,201,000 |
| 2022 | $19,209 | $1,661,700 | $682,600 | $979,100 |
| 2021 | $18,702 | $1,584,900 | $644,700 | $940,200 |
| 2020 | $17,897 | $1,552,200 | $644,700 | $907,500 |
| 2019 | $18,141 | $1,536,100 | $644,700 | $891,400 |
| 2018 | $17,763 | $1,509,200 | $644,700 | $864,500 |
| 2017 | $17,515 | $1,429,800 | $653,200 | $776,600 |
| 2016 | $17,470 | $1,398,700 | $622,100 | $776,600 |
| 2015 | $16,948 | $1,352,600 | $576,000 | $776,600 |
Source: Public Records
Map
Nearby Homes
Your Personal Tour Guide
Ask me questions while you tour the home.