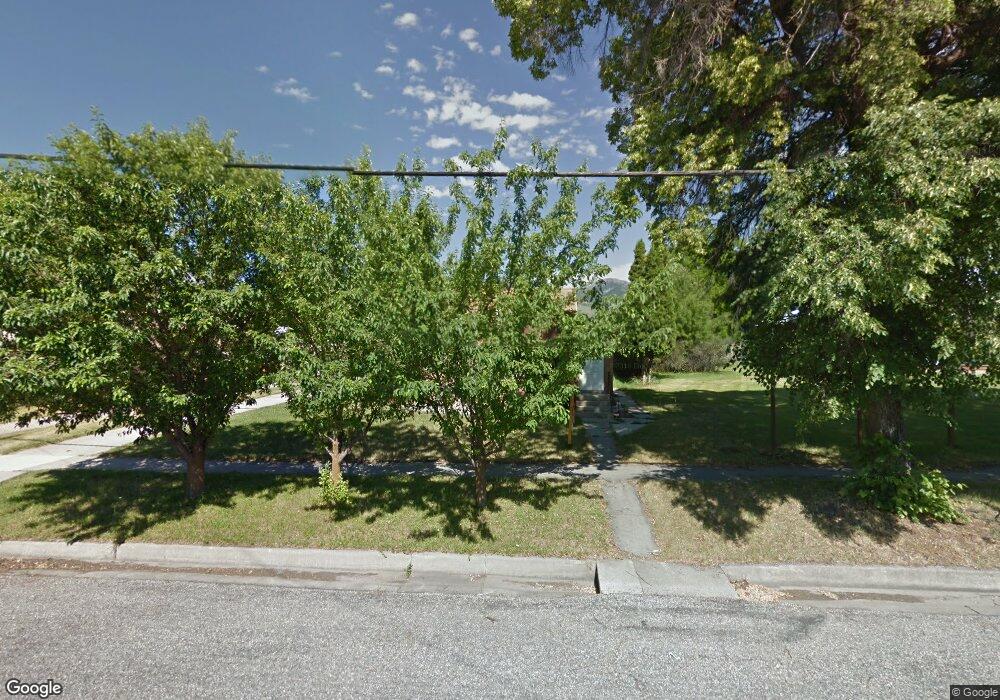
136 N 100 E Smithfield, UT 84335
Estimated Value: $334,000 - $349,000
3
Beds
1
Bath
1,256
Sq Ft
$274/Sq Ft
Est. Value
About This Home
This home is located at 136 N 100 E, Smithfield, UT 84335 and is currently estimated at $344,506, approximately $274 per square foot. 136 N 100 E is a home located in Cache County with nearby schools including Summit School, North Cache Middle School, and White Pine Middle School.
Ownership History
Date
Name
Owned For
Owner Type
Purchase Details
Closed on
Jun 21, 2016
Sold by
Christensen Kendall M
Bought by
Christensen Kendall M and Eames Bret W
Current Estimated Value
Home Financials for this Owner
Home Financials are based on the most recent Mortgage that was taken out on this home.
Original Mortgage
$128,525
Outstanding Balance
$102,148
Interest Rate
3.61%
Mortgage Type
New Conventional
Estimated Equity
$242,358
Purchase Details
Closed on
Jun 20, 2016
Sold by
Seamons Richard K and Seamons Michelle
Bought by
Christensen Kendall M
Home Financials for this Owner
Home Financials are based on the most recent Mortgage that was taken out on this home.
Original Mortgage
$128,525
Outstanding Balance
$102,148
Interest Rate
3.61%
Mortgage Type
New Conventional
Estimated Equity
$242,358
Create a Home Valuation Report for This Property
The Home Valuation Report is an in-depth analysis detailing your home's value as well as a comparison with similar homes in the area
Home Values in the Area
Average Home Value in this Area
Purchase History
| Date | Buyer | Sale Price | Title Company |
|---|---|---|---|
| Christensen Kendall M | -- | Pinnacle Title | |
| Christensen Kendall M | -- | American Secure Title Logan |
Source: Public Records
Mortgage History
| Date | Status | Borrower | Loan Amount |
|---|---|---|---|
| Open | Christensen Kendall M | $128,525 |
Source: Public Records
Tax History
| Year | Tax Paid | Tax Assessment Tax Assessment Total Assessment is a certain percentage of the fair market value that is determined by local assessors to be the total taxable value of land and additions on the property. | Land | Improvement |
|---|---|---|---|---|
| 2025 | $1,340 | $179,445 | $0 | $0 |
| 2024 | $138 | $173,640 | $0 | $0 |
| 2023 | $1,459 | $173,325 | $0 | $0 |
| 2022 | $1,326 | $154,930 | $0 | $0 |
| 2021 | $1,247 | $222,638 | $75,000 | $147,638 |
| 2020 | $1,132 | $188,568 | $75,000 | $113,568 |
| 2019 | $1,032 | $163,818 | $50,250 | $113,568 |
| 2018 | $988 | $151,650 | $50,250 | $101,400 |
| 2017 | $875 | $73,400 | $0 | $0 |
| 2016 | $891 | $63,445 | $0 | $0 |
| 2015 | $773 | $63,445 | $0 | $0 |
| 2014 | $758 | $63,450 | $0 | $0 |
| 2013 | -- | $63,450 | $0 | $0 |
Source: Public Records
Map
Nearby Homes
Your Personal Tour Guide
Ask me questions while you tour the home.