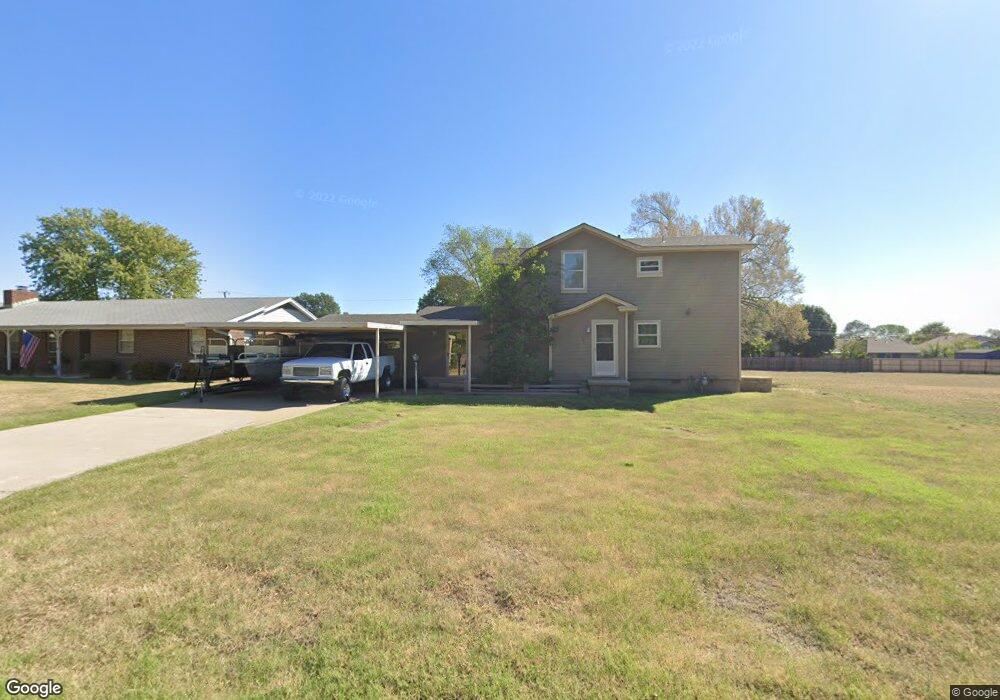
136 N Fenway Ave Bartlesville, OK 74006
Estimated Value: $154,000 - $186,000
2
Beds
4
Baths
1,708
Sq Ft
$96/Sq Ft
Est. Value
About This Home
This home is located at 136 N Fenway Ave, Bartlesville, OK 74006 and is currently estimated at $163,269, approximately $95 per square foot. 136 N Fenway Ave is a home located in Washington County with nearby schools including Woodrow Wilson Elementary School, Madison Middle School, and Bartlesville High School.
Ownership History
Date
Name
Owned For
Owner Type
Purchase Details
Closed on
Sep 20, 1993
Sold by
Snell Alice M
Current Estimated Value
Purchase Details
Closed on
Dec 21, 1983
Sold by
Snell Maurice J
Create a Home Valuation Report for This Property
The Home Valuation Report is an in-depth analysis detailing your home's value as well as a comparison with similar homes in the area
Home Values in the Area
Average Home Value in this Area
Purchase History
| Date | Buyer | Sale Price | Title Company |
|---|---|---|---|
| -- | -- | -- | |
| -- | $30,000 | -- |
Source: Public Records
Tax History Compared to Growth
Tax History
| Year | Tax Paid | Tax Assessment Tax Assessment Total Assessment is a certain percentage of the fair market value that is determined by local assessors to be the total taxable value of land and additions on the property. | Land | Improvement |
|---|---|---|---|---|
| 2025 | $940 | $7,797 | $641 | $7,156 |
| 2024 | $940 | $7,824 | $641 | $7,183 |
| 2023 | $940 | $7,451 | $641 | $6,810 |
| 2022 | $893 | $7,451 | $641 | $6,810 |
| 2021 | $875 | $7,451 | $641 | $6,810 |
| 2020 | $895 | $7,451 | $641 | $6,810 |
| 2019 | $894 | $7,445 | $641 | $6,804 |
| 2018 | $847 | $7,090 | $641 | $6,449 |
| 2017 | $826 | $6,753 | $641 | $6,112 |
| 2016 | $738 | $6,431 | $641 | $5,790 |
| 2015 | $712 | $6,125 | $641 | $5,484 |
| 2014 | $686 | $5,833 | $673 | $5,160 |
Source: Public Records
Map
Nearby Homes
- 4513 Tuxedo Blvd
- 208 NE Spruce Ave
- 309 N Spruce Ave
- 4212 Michigan St
- 348 N Fenway Ave
- 305 NE Myers Ave
- 440 NE Elmhurst Ave
- 313 S Fenway Place
- 4600 Cara Lee Ln
- 300 SE Waverly Ave
- 4816 Carole Ct
- 202 Bradley Place
- 328 SE Waverly Ave
- 366 SE Wilshire Ave
- 605 N Spruce Ave
- 404 NE Avondale Ave
- 624 NE Fenway Ave
- 397 Fleetwood Dr
- 4507 E Frank Phillips Blvd
- 174 Parkhill Place
- 140 N Fenway Ave
- 144 N Fenway Ave
- 103 N Fenway Ave
- 131 N Fenway Ave
- 141 N Fenway Ave
- 129 N Fenway Ave
- 200 N Fenway Ave
- 147 N Fenway Ave
- 157 N Cummings Ave
- 149 N Cummings Ave
- 165 N Cummings Ave
- 125 N Fenway Ave
- 141 N Cummings Ave
- 173 N Cummings Ave
- 133 N Cummings Ave
- 210 N Fenway Ave
- 119 N Fenway Ave
- 125 N Cummings Ave
- 207 N Fenway Ave
- 113 N Fenway Ave