Estimated Value: $112,487 - $143,000
--
Bed
--
Bath
1,260
Sq Ft
$101/Sq Ft
Est. Value
About This Home
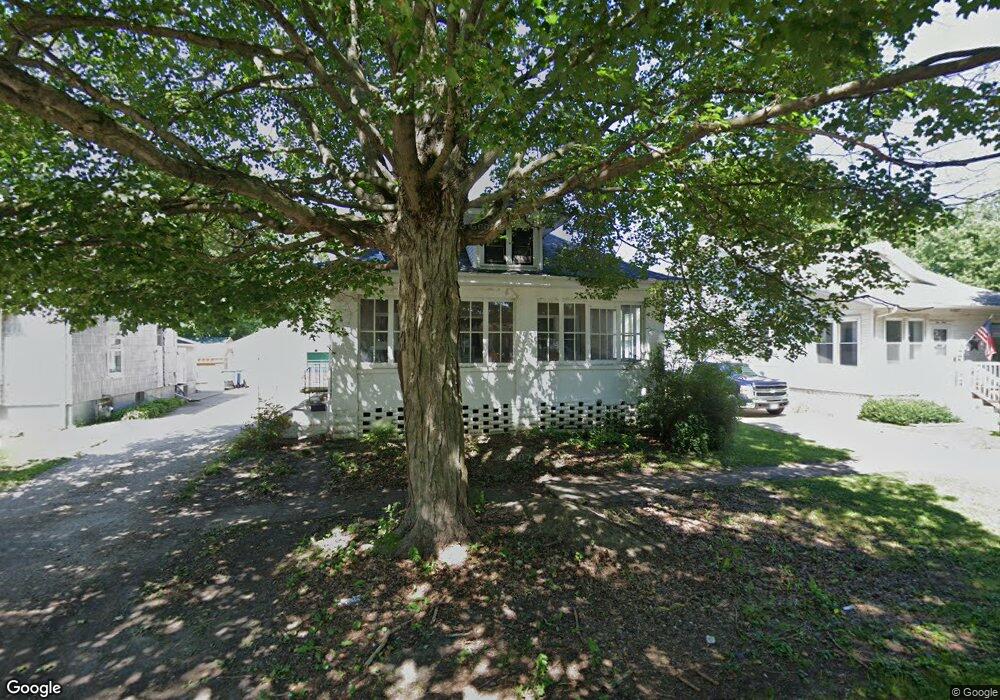
This home is located at 136 N Jones Ave, Amboy, IL 61310 and is currently estimated at $127,122, approximately $100 per square foot. 136 N Jones Ave is a home located in Lee County with nearby schools including Amboy Central Elementary School, Amboy Junior High School, and Amboy High School.
Ownership History
Date
Name
Owned For
Owner Type
Purchase Details
Closed on
Apr 11, 2024
Sold by
Jones Gary and Hazel R Jones Estate Hazel R Jones Estate
Bought by
Lehman James Paul and Lehman Jodie Ann
Current Estimated Value
Create a Home Valuation Report for This Property
The Home Valuation Report is an in-depth analysis detailing your home's value as well as a comparison with similar homes in the area
Home Values in the Area
Average Home Value in this Area
Purchase History
| Date | Buyer | Sale Price | Title Company |
|---|---|---|---|
| Lehman James Paul | -- | None Available |
Source: Public Records
Tax History Compared to Growth
Tax History
| Year | Tax Paid | Tax Assessment Tax Assessment Total Assessment is a certain percentage of the fair market value that is determined by local assessors to be the total taxable value of land and additions on the property. | Land | Improvement |
|---|---|---|---|---|
| 2024 | $1,874 | $32,930 | $2,846 | $30,084 |
| 2023 | $1,586 | $28,635 | $2,475 | $26,160 |
| 2022 | $1,421 | $26,271 | $2,271 | $24,000 |
| 2021 | $1,525 | $27,325 | $2,207 | $25,118 |
| 2020 | $1,479 | $26,529 | $2,143 | $24,386 |
| 2019 | $1,456 | $25,757 | $2,081 | $23,676 |
| 2018 | $1,353 | $24,531 | $1,982 | $22,549 |
| 2017 | $1,123 | $23,344 | $1,982 | $21,362 |
| 2016 | $1,115 | $23,344 | $1,982 | $21,362 |
| 2015 | $1,109 | $23,344 | $1,982 | $21,362 |
| 2014 | $1,196 | $23,344 | $1,982 | $21,362 |
| 2013 | $1,483 | $27,954 | $2,485 | $25,469 |
Source: Public Records
Map
Nearby Homes
- 300 E Division St
- 133 N East Ave
- 1 E Main St
- 25 W Main St
- 227 W Provost St
- 16 W Wasson Rd Unit 19
- 16 W Wasson Rd
- 1713 Nauman Rd
- 1061 Robbins Rd
- 1306 Whitney Rd
- 9/46 Woodhaven Dr
- 8/110 Woodhaven Dr
- 1/136&137 Woodhaven Dr
- 4/2 Woodhaven Dr
- 16/158 Woodhaven Dr
- 2/292 Woodhaven Dr
- 21/211 Woodhaven Dr
- 17/100 Woodhaven Dr
- 2/141&142 Woodhaven Dr
- 26/140 Woodhaven Dr E
- 140 N Jones Ave
- 132 N Jones Ave
- 142 N Jones Ave
- 124 N Jones Ave
- 135 N Metcalf Ave
- 133 N Jones St
- 201 E Bacon St
- 145 N Metcalf Ave
- 133 N Jones Ave
- 137 N Jones Ave
- 127 N Metcalf Ave
- 131 N Jones Ave
- 222 N Jones Ave
- 120 N Jones Ave
- 127 N Jones Ave
- 123 N Jones Ave
- 123 N Metcalf Ave
- 116 N Jones Ave
- 121 N Jones Ave
- 207 N Jones Ave