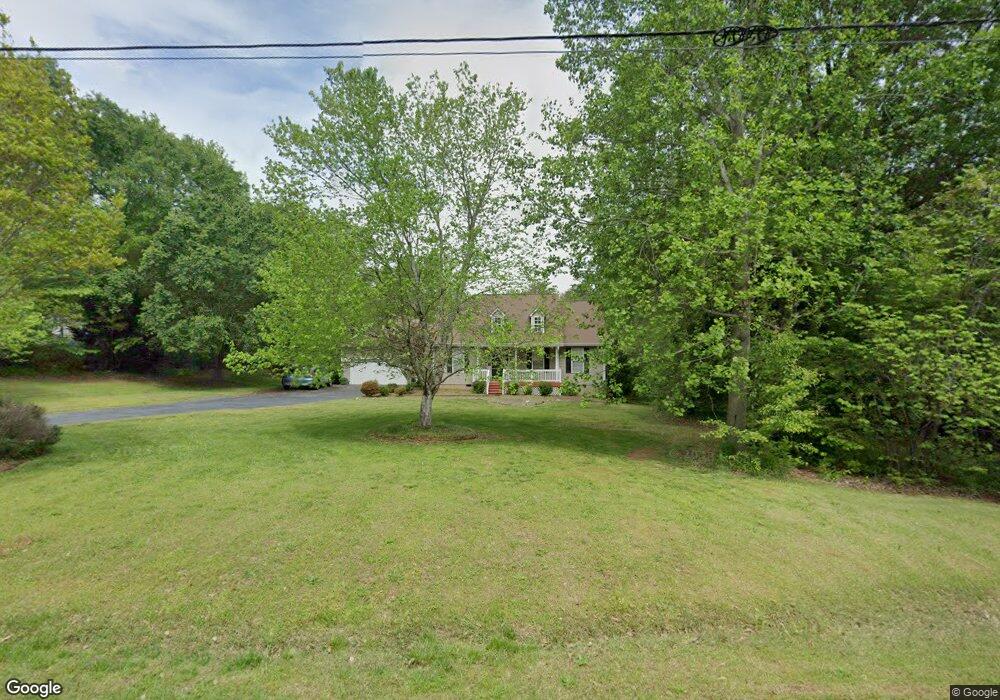
136 New Harrison Bridge Rd Simpsonville, SC 29680
Estimated Value: $392,000 - $469,000
3
Beds
2
Baths
2,389
Sq Ft
$183/Sq Ft
Est. Value
About This Home
This home is located at 136 New Harrison Bridge Rd, Simpsonville, SC 29680 and is currently estimated at $437,398, approximately $183 per square foot. 136 New Harrison Bridge Rd is a home located in Greenville County with nearby schools including Fork Shoals School, Ralph Chandler Middle, and Woodmont High School.
Ownership History
Date
Name
Owned For
Owner Type
Purchase Details
Closed on
Feb 8, 2017
Sold by
Simpson Allison Leigh and Askins Donna
Bought by
Gambrell Debra A
Current Estimated Value
Home Financials for this Owner
Home Financials are based on the most recent Mortgage that was taken out on this home.
Original Mortgage
$210,826
Outstanding Balance
$172,313
Interest Rate
3.75%
Mortgage Type
FHA
Estimated Equity
$265,085
Purchase Details
Closed on
Mar 16, 2016
Sold by
Simpson Tyler Jay
Bought by
Simpson Allison Leigh
Purchase Details
Closed on
Jun 25, 2014
Sold by
Godwin James H and Godwin Janet M
Bought by
Simpson Tyler J and Simpson Allison L
Home Financials for this Owner
Home Financials are based on the most recent Mortgage that was taken out on this home.
Original Mortgage
$211,500
Interest Rate
4.17%
Mortgage Type
Future Advance Clause Open End Mortgage
Purchase Details
Closed on
Aug 1, 2001
Sold by
Long Jay C
Bought by
Godwin James H
Create a Home Valuation Report for This Property
The Home Valuation Report is an in-depth analysis detailing your home's value as well as a comparison with similar homes in the area
Home Values in the Area
Average Home Value in this Area
Purchase History
| Date | Buyer | Sale Price | Title Company |
|---|---|---|---|
| Gambrell Debra A | $259,000 | None Available | |
| Simpson Allison Leigh | -- | None Available | |
| Simpson Tyler J | $235,000 | -- | |
| Godwin James H | $161,000 | -- |
Source: Public Records
Mortgage History
| Date | Status | Borrower | Loan Amount |
|---|---|---|---|
| Open | Gambrell Debra A | $210,826 | |
| Previous Owner | Simpson Tyler J | $211,500 |
Source: Public Records
Tax History Compared to Growth
Tax History
| Year | Tax Paid | Tax Assessment Tax Assessment Total Assessment is a certain percentage of the fair market value that is determined by local assessors to be the total taxable value of land and additions on the property. | Land | Improvement |
|---|---|---|---|---|
| 2024 | $1,338 | $10,480 | $1,080 | $9,400 |
| 2023 | $1,338 | $10,480 | $1,080 | $9,400 |
| 2022 | $1,304 | $10,480 | $1,080 | $9,400 |
| 2021 | $1,305 | $10,480 | $1,080 | $9,400 |
| 2020 | $1,555 | $9,650 | $670 | $8,980 |
| 2019 | $1,555 | $9,650 | $670 | $8,980 |
| 2018 | $1,499 | $9,650 | $670 | $8,980 |
| 2017 | $1,440 | $9,250 | $670 | $8,580 |
| 2016 | $1,384 | $231,330 | $16,800 | $214,530 |
| 2015 | $1,387 | $231,330 | $16,800 | $214,530 |
| 2014 | $747 | $179,430 | $16,800 | $162,630 |
Source: Public Records
Map
Nearby Homes
- 225 Tea Olive Place
- 196 New Harrison Bridge Rd
- 106 Knoll Creek Dr
- 430 Wilson Bridge Rd
- 907 Sugar Oak Ct
- 201 Engelmann Ln
- 4 Lenten Rose Ct
- 304 Farmwood Dr
- 330 New Harrison Bridge Rd
- 9 Emporia Ct
- 412 Kindletree Way
- 303 Jenkins Bridge Rd
- 3 Heatherfield Dr
- 604 Holtview Place
- 810 Fairview Rd
- 214 Rivers Edge Cir
- 252 Ridge Way
- 288 S Carolina 418
- 6 Dunbrook Dr
- 814 Camberwell Rd
- 146 New Harrison Bridge Rd
- 100 Lacebark Ct Unit Home Site 78
- 100 Lacebark Ct
- 154 New Harrison Bridge Rd
- 104 Lacebark Ct Unit Home Site 77
- 104 Lacebark Ct
- 101 Lacebark Ct
- 120 New Harrison Bridge Rd
- 148 New Harrison Bridge Rd
- 105 Lacebark Ct
- 108 Lacebark Ct
- 118 New Harrison Bridge Rd
- 158 New Harrison Bridge Rd
- 121 New Harrison Bridge Rd
- 109 Lacebark Ct
- 112 Lacebark Ct
- 150 New Harrison Bridge Rd
- 150 New Harrison Bridge Rd
- 116 Lacebark Ct
- 1 Tea Olive Place Unit Home site 4