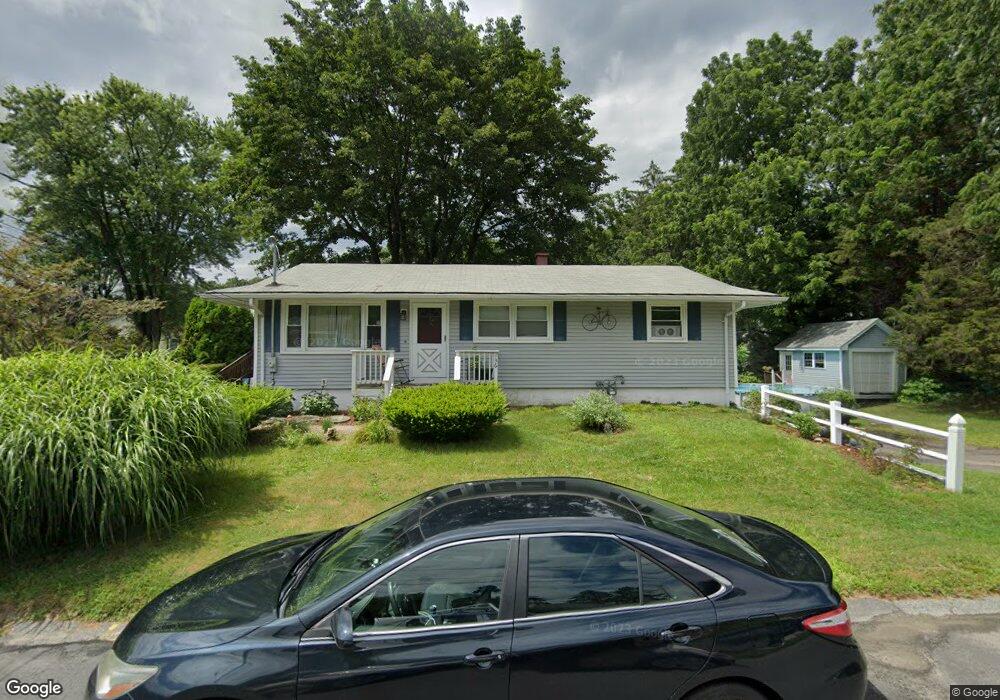
136 Newton St Woonsocket, RI 02895
East Woonsocket NeighborhoodEstimated Value: $387,000 - $417,363
3
Beds
2
Baths
1,872
Sq Ft
$214/Sq Ft
Est. Value
About This Home
This home is located at 136 Newton St, Woonsocket, RI 02895 and is currently estimated at $401,341, approximately $214 per square foot. 136 Newton St is a home located in Providence County with nearby schools including Woonsocket High School and Good Shepherd Catholic School.
Ownership History
Date
Name
Owned For
Owner Type
Purchase Details
Closed on
Feb 18, 2015
Sold by
Kirby Jeannette G
Bought by
Beauchemin Travis J and Beachamin Francine A
Current Estimated Value
Home Financials for this Owner
Home Financials are based on the most recent Mortgage that was taken out on this home.
Original Mortgage
$127,187
Outstanding Balance
$97,059
Interest Rate
3.74%
Mortgage Type
New Conventional
Estimated Equity
$304,282
Purchase Details
Closed on
Jul 23, 2010
Sold by
Edward O Boucher T
Bought by
Beauchemin Raymond L
Create a Home Valuation Report for This Property
The Home Valuation Report is an in-depth analysis detailing your home's value as well as a comparison with similar homes in the area
Home Values in the Area
Average Home Value in this Area
Purchase History
| Date | Buyer | Sale Price | Title Company |
|---|---|---|---|
| Beauchemin Travis J | $187,000 | -- | |
| Beauchemin Travis J | $125,000 | -- | |
| Beauchemin Raymond L | $168,000 | -- | |
| Beauchemin Travis J | $125,000 | -- | |
| Beauchemin Raymond L | $168,000 | -- |
Source: Public Records
Mortgage History
| Date | Status | Borrower | Loan Amount |
|---|---|---|---|
| Open | Beauchemin Raymond L | $127,187 | |
| Closed | Beauchemin Raymond L | $127,187 |
Source: Public Records
Tax History Compared to Growth
Tax History
| Year | Tax Paid | Tax Assessment Tax Assessment Total Assessment is a certain percentage of the fair market value that is determined by local assessors to be the total taxable value of land and additions on the property. | Land | Improvement |
|---|---|---|---|---|
| 2025 | $4,317 | $384,400 | $108,000 | $276,400 |
| 2024 | $3,639 | $250,300 | $88,100 | $162,200 |
| 2023 | $3,499 | $250,300 | $88,100 | $162,200 |
| 2022 | $3,499 | $250,300 | $88,100 | $162,200 |
| 2021 | $4,275 | $180,000 | $70,800 | $109,200 |
| 2020 | $4,320 | $180,000 | $70,800 | $109,200 |
| 2018 | $4,334 | $180,000 | $70,800 | $109,200 |
| 2017 | $4,413 | $146,600 | $65,400 | $81,200 |
| 2016 | $4,668 | $146,600 | $65,400 | $81,200 |
| 2015 | $5,363 | $146,600 | $65,400 | $81,200 |
| 2014 | $5,502 | $153,100 | $72,000 | $81,100 |
Source: Public Records
Map
Nearby Homes