Estimated Value: $339,000 - $348,000
3
Beds
2
Baths
1,690
Sq Ft
$204/Sq Ft
Est. Value
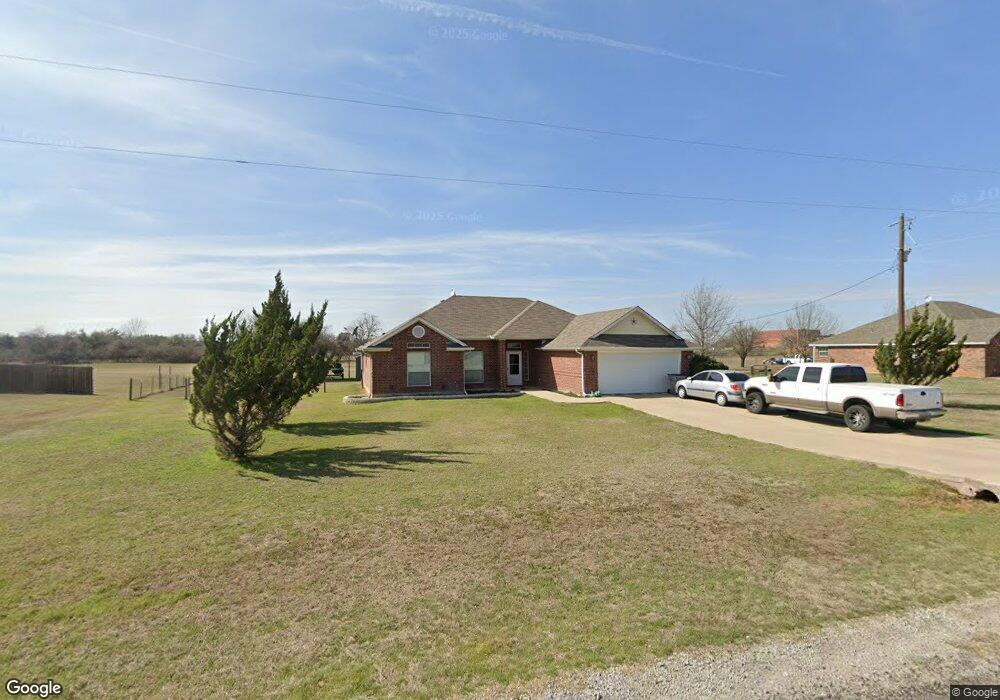
About This Home
This home is located at 136 Pleasant Run, Azle, TX 76020 and is currently estimated at $344,320, approximately $203 per square foot. 136 Pleasant Run is a home located in Parker County with nearby schools including Springtown Reno Elementary School, Springtown Intermediate School, and Springtown Middle School.
Ownership History
Date
Name
Owned For
Owner Type
Purchase Details
Closed on
May 4, 2017
Sold by
Reeves Cecil W and Reeves Deborah K
Bought by
Gomez Gary J and Gomez Jana
Current Estimated Value
Purchase Details
Closed on
May 21, 2007
Sold by
Rhino Group L P
Bought by
Gomez Gary J and Gomez Jana
Purchase Details
Closed on
Mar 21, 2007
Sold by
Rhino Group Lp
Bought by
Reeves Cecil W and Reeves Deborah K
Home Financials for this Owner
Home Financials are based on the most recent Mortgage that was taken out on this home.
Original Mortgage
$50,000
Interest Rate
6.26%
Mortgage Type
Purchase Money Mortgage
Purchase Details
Closed on
Aug 1, 2006
Sold by
Elliott Jennifer and Elliott Glenn
Bought by
First National Bank Of Weatherford
Purchase Details
Closed on
May 7, 2003
Sold by
Sullivan Green Russell
Bought by
Gomez Gary J and Gomez Jana
Create a Home Valuation Report for This Property
The Home Valuation Report is an in-depth analysis detailing your home's value as well as a comparison with similar homes in the area
Home Values in the Area
Average Home Value in this Area
Purchase History
| Date | Buyer | Sale Price | Title Company |
|---|---|---|---|
| Gomez Gary J | $151,950 | None Available | |
| Gomez Gary J | -- | -- | |
| Reeves Cecil W | -- | Dhi Title | |
| First National Bank Of Weatherford | $155,400 | None Available | |
| Gomez Gary J | -- | -- |
Source: Public Records
Mortgage History
| Date | Status | Borrower | Loan Amount |
|---|---|---|---|
| Previous Owner | Reeves Cecil W | $50,000 |
Source: Public Records
Tax History
| Year | Tax Paid | Tax Assessment Tax Assessment Total Assessment is a certain percentage of the fair market value that is determined by local assessors to be the total taxable value of land and additions on the property. | Land | Improvement |
|---|---|---|---|---|
| 2025 | $4,860 | $344,740 | $80,000 | $264,740 |
| 2024 | $4,860 | $335,120 | $80,000 | $255,120 |
| 2023 | $4,860 | $332,600 | $80,000 | $252,600 |
| 2022 | $5,099 | $237,050 | $50,000 | $187,050 |
| 2021 | $5,584 | $237,050 | $50,000 | $187,050 |
| 2020 | $5,026 | $213,940 | $40,000 | $173,940 |
| 2019 | $5,335 | $213,940 | $40,000 | $173,940 |
Source: Public Records
Map
Nearby Homes
- 109 Pleasant Run
- TBD W Browder Cir
- 161 E Reno Rd
- 110 Tiffany Ct
- 934 Tiffany St
- 445 Arvel Cir
- 1060 E Reno Rd
- 979 E Barry St
- 975 E Barry St
- 1170 Arvel Cir Unit C
- 1170 Arvel Cir Unit B
- 1170 Arvel Cir Unit A
- TBD Nelson Rd
- 610 S Cardinal Rd
- 845 N Cardinal Rd
- 1134 Ladybird Ln
- 1012 Katie Ct
- 1016 Katie Ct
- 401 Ashwood St
- 315 Ashwood St
- 140 Pleasant Run
- 132 Pleasant Run
- 128 Pleasant Run
- 144 Pleasant Run
- 133 Pleasant Run
- 124 Pleasant Run
- 148 Pleasant Run
- 137 Pleasant Run
- 141 Pleasant Run
- 129 Pleasant Run
- 125 Pleasant Run
- 145 Pleasant Run
- 152 Pleasant Run
- 120 Pleasant Run
- 121 Pleasant Run
- 116 Pleasant Run
- 117 Pleasant Run
- 112 Pleasant Run
- 140 Parsonage St
- 113 Pleasant Run
Your Personal Tour Guide
Ask me questions while you tour the home.