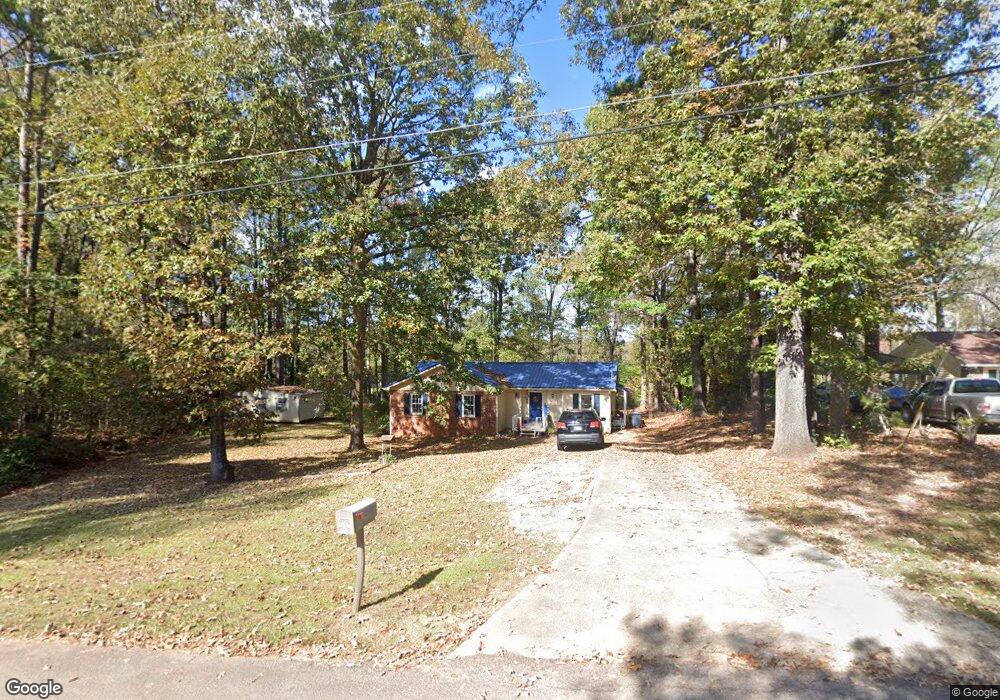
136 Rob Roy Rd Lagrange, GA 30240
Estimated Value: $184,000 - $208,424
3
Beds
3
Baths
1,465
Sq Ft
$134/Sq Ft
Est. Value
About This Home
This home is located at 136 Rob Roy Rd, Lagrange, GA 30240 and is currently estimated at $196,606, approximately $134 per square foot. 136 Rob Roy Rd is a home located in Troup County with nearby schools including Long Cane Elementary School, Berta Weathersbee Elementary School, and Whitesville Road Elementary School.
Ownership History
Date
Name
Owned For
Owner Type
Purchase Details
Closed on
Jul 24, 2025
Sold by
Fincher Mary C
Bought by
Fincher Brandon Travis and Fincher Caitlynne Alexis
Current Estimated Value
Home Financials for this Owner
Home Financials are based on the most recent Mortgage that was taken out on this home.
Original Mortgage
$183,121
Outstanding Balance
$182,806
Interest Rate
6.77%
Mortgage Type
FHA
Estimated Equity
$13,800
Purchase Details
Closed on
Jan 17, 2024
Sold by
Murdock Thomas
Bought by
Murdock Thomas and Keller Cheryl
Purchase Details
Closed on
Aug 23, 2000
Sold by
Secretary Of Veterans Affairs
Bought by
Pittman Mary
Purchase Details
Closed on
Feb 2, 2000
Sold by
Regions Mortgage Inc
Bought by
Secretary Of Veterans Affairs
Purchase Details
Closed on
Feb 1, 2000
Sold by
Charles Darren and Gerrie Wiker
Bought by
Regions Mortgage Inc
Purchase Details
Closed on
Oct 4, 1994
Sold by
Crowder Mark and Crowder Isa
Bought by
Charles Darren and Gerrie Wiker
Purchase Details
Closed on
Oct 1, 1986
Purchase Details
Closed on
Mar 1, 1985
Purchase Details
Closed on
Jan 1, 1985
Purchase Details
Closed on
Sep 25, 1978
Purchase Details
Closed on
May 30, 1975
Create a Home Valuation Report for This Property
The Home Valuation Report is an in-depth analysis detailing your home's value as well as a comparison with similar homes in the area
Purchase History
| Date | Buyer | Sale Price | Title Company |
|---|---|---|---|
| Fincher Brandon Travis | $186,500 | -- | |
| Murdock Thomas | -- | -- | |
| Pittman Mary | -- | -- | |
| Secretary Of Veterans Affairs | $51,100 | -- | |
| Regions Mortgage Inc | $51,100 | -- | |
| Charles Darren | $60,000 | -- | |
| -- | $55,100 | -- | |
| Crowder Mark | -- | -- | |
| -- | -- | -- | |
| -- | -- | -- | |
| -- | -- | -- | |
| -- | -- | -- |
Source: Public Records
Mortgage History
| Date | Status | Borrower | Loan Amount |
|---|---|---|---|
| Open | Fincher Brandon Travis | $183,121 |
Source: Public Records
Tax History
| Year | Tax Paid | Tax Assessment Tax Assessment Total Assessment is a certain percentage of the fair market value that is determined by local assessors to be the total taxable value of land and additions on the property. | Land | Improvement |
|---|---|---|---|---|
| 2025 | $1,818 | $73,532 | $14,000 | $59,532 |
| 2024 | $1,575 | $59,740 | $14,000 | $45,740 |
| 2023 | $1,100 | $60,220 | $14,000 | $46,220 |
| 2022 | $1,434 | $53,380 | $10,000 | $43,380 |
| 2021 | $1,182 | $41,168 | $10,000 | $31,168 |
| 2020 | $1,061 | $37,168 | $6,000 | $31,168 |
| 2019 | $1,120 | $39,136 | $6,000 | $33,136 |
| 2018 | $1,049 | $36,760 | $6,160 | $30,600 |
| 2017 | $1,049 | $36,760 | $6,160 | $30,600 |
| 2016 | $1,052 | $36,851 | $6,160 | $30,691 |
| 2015 | $990 | $34,734 | $6,160 | $28,574 |
| 2014 | $946 | $33,230 | $6,160 | $27,070 |
| 2013 | -- | $34,130 | $6,160 | $27,970 |
Source: Public Records
Map
Nearby Homes
- 105 Redwood Dr
- 3009 Old West Point Rd
- 22 Freeman Rd
- 0 Glass Bridge Rd Unit 10679358
- 640 Hudson Rd
- 288 Bradfield Dr
- 808 S Fling Rd
- 2239 Pegasus Pkwy
- 0 Bradfield Dr Unit 10568803
- 8 Horace Carter Rd
- 509 Connie Dr
- 427 Fling Rd
- 112 Foxdale Dr
- 402 Ginger Cir
- 102 Bridgewater Dr
- 113 Colonial Ct Unit 100
- 311 Cumberland Dr
- 124 Lincoln Ln
- 101 Ivy Springs Dr
- 0 Cannonville Rd
- 134 Rob Roy Rd
- 140 Rob Roy Rd
- 135 Rob Roy Rd
- 132 Rob Roy Rd
- 137 Rob Roy Rd
- 133 Rob Roy Rd
- 142 Rob Roy Rd
- 130 Rob Roy Rd
- 131 Rob Roy Rd
- 143 Rob Roy Rd
- 146 Rob Roy Rd
- 5030 Old West Point Rd
- 145 Rob Roy Rd
- 5028 Old West Point Rd
- 5032 Old West Point Rd
- 5026 Old West Point Rd
- 5034 Old West Point Rd
- 147 Rob Roy Rd
- 5024 Old West Point Rd
- 5036 Old West Point Rd
Your Personal Tour Guide
Ask me questions while you tour the home.