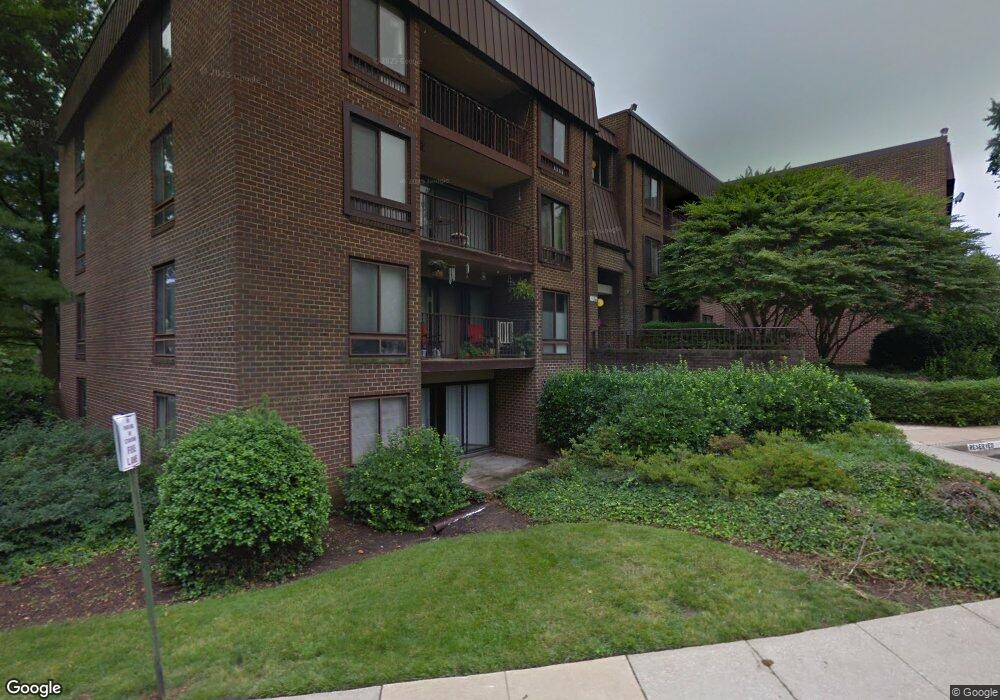
136 Roberts Ln Unit 402 Alexandria, VA 22314
Taylor Run NeighborhoodEstimated Value: $328,000 - $381,000
1
Bed
1
Bath
843
Sq Ft
$411/Sq Ft
Est. Value
About This Home
This home is located at 136 Roberts Ln Unit 402, Alexandria, VA 22314 and is currently estimated at $346,561, approximately $411 per square foot. 136 Roberts Ln Unit 402 is a home located in Alexandria City with nearby schools including Douglas Macarthur Elementary School, George Washington Middle School, and Alexandria City High School.
Ownership History
Date
Name
Owned For
Owner Type
Purchase Details
Closed on
Oct 16, 2009
Sold by
Test Adm Robert J and Estate Of John Anthony Dlugos
Bought by
Marsh Bruce R
Current Estimated Value
Home Financials for this Owner
Home Financials are based on the most recent Mortgage that was taken out on this home.
Original Mortgage
$207,824
Outstanding Balance
$136,121
Interest Rate
5.14%
Mortgage Type
FHA
Estimated Equity
$210,440
Purchase Details
Closed on
Apr 2, 2003
Sold by
Gattuso James
Bought by
Dlugos John
Home Financials for this Owner
Home Financials are based on the most recent Mortgage that was taken out on this home.
Original Mortgage
$145,400
Interest Rate
5.88%
Mortgage Type
FHA
Create a Home Valuation Report for This Property
The Home Valuation Report is an in-depth analysis detailing your home's value as well as a comparison with similar homes in the area
Home Values in the Area
Average Home Value in this Area
Purchase History
| Date | Buyer | Sale Price | Title Company |
|---|---|---|---|
| Marsh Bruce R | $215,000 | -- | |
| Dlugos John | $149,900 | -- |
Source: Public Records
Mortgage History
| Date | Status | Borrower | Loan Amount |
|---|---|---|---|
| Open | Marsh Bruce R | $207,824 | |
| Previous Owner | Dlugos John | $145,400 |
Source: Public Records
Tax History Compared to Growth
Tax History
| Year | Tax Paid | Tax Assessment Tax Assessment Total Assessment is a certain percentage of the fair market value that is determined by local assessors to be the total taxable value of land and additions on the property. | Land | Improvement |
|---|---|---|---|---|
| 2025 | $3,530 | $336,102 | $106,594 | $229,508 |
| 2024 | $3,530 | $303,236 | $96,171 | $207,065 |
| 2023 | $3,366 | $303,236 | $96,171 | $207,065 |
| 2022 | $3,566 | $321,242 | $96,171 | $225,071 |
| 2021 | $3,496 | $314,943 | $94,285 | $220,658 |
| 2020 | $3,334 | $302,830 | $90,659 | $212,171 |
| 2019 | $3,169 | $280,399 | $83,944 | $196,455 |
| 2018 | $3,076 | $272,232 | $81,499 | $190,733 |
| 2017 | $2,987 | $264,302 | $79,125 | $185,177 |
| 2016 | $3,072 | $286,335 | $79,125 | $207,210 |
| 2015 | $2,905 | $278,557 | $79,125 | $199,432 |
| 2014 | $2,822 | $270,521 | $75,000 | $195,521 |
Source: Public Records
Map
Nearby Homes
- 126 Roberts Ln Unit 101
- 110 Roberts Ln Unit 301
- 122 Roberts Ln Unit 400
- 127 Moncure Dr
- 59 E Taylor Run Pkwy
- 133 E Taylor Run Pkwy
- 607 W View Terrace
- 605 Hilltop Terrace
- 310 Moncure Dr
- 53 Skyhill Rd Unit 301
- 53 Skyhill Rd Unit 204
- 206 N View Terrace
- 51 Skyhill Rd Unit 202
- 49 Skyhill Rd Unit 201
- 2151 Jamieson Ave Unit 809
- 2151 Jamieson Ave Unit 601
- 2121 Jamieson Ave Unit 710
- 2121 Jamieson Ave Unit 1501
- 2121 Jamieson Ave Unit 401
- 2121 Jamieson Ave Unit 609
- 136 Roberts Ln Unit 203
- 136 Roberts Ln Unit 403
- 136 Roberts Ln Unit 301
- 136 Roberts Ln Unit 201
- 136 Roberts Ln Unit 302
- 136 Roberts Ln Unit 101
- 136 Roberts Ln Unit 200
- 136 Roberts Ln Unit 401
- 136 Roberts Ln Unit 400
- 136 Roberts Ln Unit 303
- 136 Roberts Ln Unit 300
- 136 Roberts Ln Unit 202
- 134 Roberts Ln Unit 402
- 134 Roberts Ln Unit 403
- 134 Roberts Ln Unit 401
- 134 Roberts Ln Unit 101
- 134 Roberts Ln Unit 400
- 134 Roberts Ln Unit 301
- 134 Roberts Ln Unit 303
- 134 Roberts Ln Unit 302