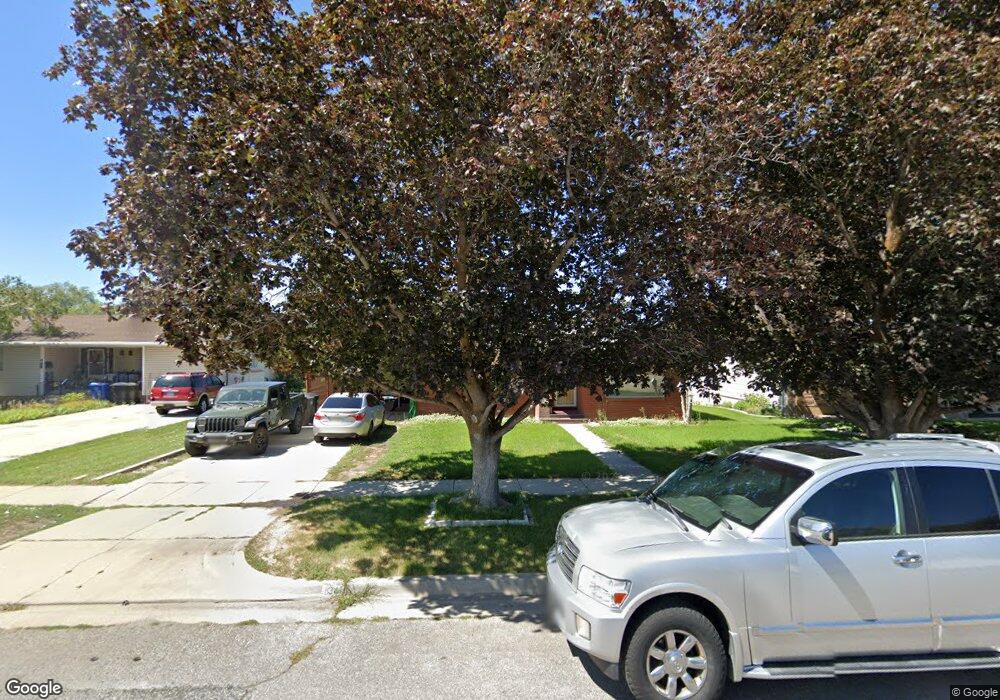
136 S 400 W Brigham City, UT 84302
Estimated Value: $397,000 - $441,000
4
Beds
2
Baths
2,196
Sq Ft
$190/Sq Ft
Est. Value
About This Home
This home is located at 136 S 400 W, Brigham City, UT 84302 and is currently estimated at $416,674, approximately $189 per square foot. 136 S 400 W is a home located in Box Elder County with nearby schools including Lake View Elementary School, Adele C. Young Intermediate School, and Box Elder Middle School.
Ownership History
Date
Name
Owned For
Owner Type
Purchase Details
Closed on
Jul 10, 2019
Sold by
Talbot Abel Chasity and Talbot Abel Shane
Bought by
Bertlshofer Miles T
Current Estimated Value
Home Financials for this Owner
Home Financials are based on the most recent Mortgage that was taken out on this home.
Original Mortgage
$208,453
Outstanding Balance
$182,923
Interest Rate
3.9%
Mortgage Type
New Conventional
Estimated Equity
$233,751
Purchase Details
Closed on
Dec 1, 2014
Sold by
Talbot 3 Llc
Bought by
Abel Chasity and Abel Shane Talbot
Home Financials for this Owner
Home Financials are based on the most recent Mortgage that was taken out on this home.
Original Mortgage
$132,653
Interest Rate
3.92%
Mortgage Type
New Conventional
Purchase Details
Closed on
Mar 14, 2012
Sold by
Child Phyllis
Bought by
Talbot 3 Llc
Create a Home Valuation Report for This Property
The Home Valuation Report is an in-depth analysis detailing your home's value as well as a comparison with similar homes in the area
Home Values in the Area
Average Home Value in this Area
Purchase History
| Date | Buyer | Sale Price | Title Company |
|---|---|---|---|
| Bertlshofer Miles T | -- | Northern Title Company | |
| Abel Chasity | -- | Backman Title Services Ltd | |
| Talbot 3 Llc | -- | None Available |
Source: Public Records
Mortgage History
| Date | Status | Borrower | Loan Amount |
|---|---|---|---|
| Open | Bertlshofer Miles T | $208,453 | |
| Previous Owner | Abel Chasity | $132,653 |
Source: Public Records
Tax History Compared to Growth
Tax History
| Year | Tax Paid | Tax Assessment Tax Assessment Total Assessment is a certain percentage of the fair market value that is determined by local assessors to be the total taxable value of land and additions on the property. | Land | Improvement |
|---|---|---|---|---|
| 2025 | $1,784 | $455,838 | $210,000 | $245,838 |
| 2024 | $1,784 | $343,539 | $100,000 | $243,539 |
| 2023 | $1,840 | $362,652 | $95,000 | $267,652 |
| 2022 | $1,827 | $184,146 | $22,000 | $162,146 |
| 2021 | $1,397 | $213,500 | $40,000 | $173,500 |
| 2020 | $1,314 | $213,500 | $40,000 | $173,500 |
| 2019 | $1,231 | $106,447 | $22,000 | $84,447 |
| 2018 | $1,110 | $95,432 | $22,000 | $73,432 |
| 2017 | $873 | $129,982 | $16,500 | $99,982 |
| 2016 | $915 | $68,872 | $16,500 | $52,372 |
| 2015 | $853 | $64,110 | $16,500 | $47,610 |
| 2014 | $853 | $61,843 | $16,500 | $45,343 |
| 2013 | -- | $61,843 | $16,500 | $45,343 |
Source: Public Records
Map
Nearby Homes
- 526 W 200 S
- 423 W Forest St
- 315 S 500 W
- 133 W Forest St
- 436 S 500 W
- 105 N 300 W
- 95 N 200 W
- 216 W 100 N
- 135 W 100 N
- 116 N 600 W
- 410 S 100 E
- 515 S 700 W
- 562 S 300 W
- 117 W 200 N
- 1182 W 500 S
- Tourmaline Plan at Beeton Path - Seasons
- Coral Plan at Beeton Path - Seasons
- Citrine Plan at Beeton Path - Seasons
- Lapis Plan at Beeton Path - Seasons
- 557 S Main St Unit 5