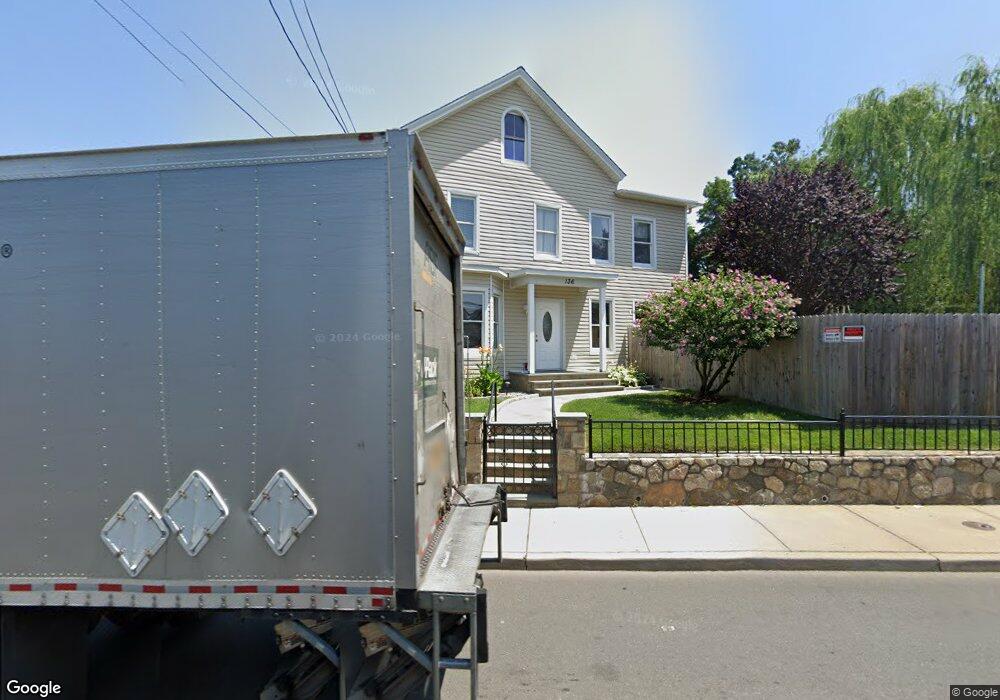
136 S Main St Norwalk, CT 06854
South Norwalk NeighborhoodEstimated Value: $496,000 - $679,000
5
Beds
2
Baths
2,026
Sq Ft
$294/Sq Ft
Est. Value
About This Home
This home is located at 136 S Main St, Norwalk, CT 06854 and is currently estimated at $594,851, approximately $293 per square foot. 136 S Main St is a home located in Fairfield County with nearby schools including Silvermine Elementary School, West Rocks Middle School, and Norwalk High School.
Ownership History
Date
Name
Owned For
Owner Type
Purchase Details
Closed on
Feb 4, 2025
Sold by
Torres Emiliano
Bought by
Torres Emilio
Current Estimated Value
Purchase Details
Closed on
Jan 28, 2022
Sold by
Torres Emiliano
Bought by
Torres Emilio
Purchase Details
Closed on
Jan 4, 2010
Sold by
Jp Morgan Chase Bk
Bought by
Torres Emilianc
Home Financials for this Owner
Home Financials are based on the most recent Mortgage that was taken out on this home.
Original Mortgage
$203,500
Interest Rate
5%
Mortgage Type
Purchase Money Mortgage
Purchase Details
Closed on
Nov 7, 2008
Sold by
Kenez Robert and Kenez Tracey A
Bought by
Washington Mutual Bk
Purchase Details
Closed on
Jun 8, 2000
Sold by
Kenez Lydia Est and Barbarula
Bought by
Kenez Robert E
Create a Home Valuation Report for This Property
The Home Valuation Report is an in-depth analysis detailing your home's value as well as a comparison with similar homes in the area
Home Values in the Area
Average Home Value in this Area
Purchase History
| Date | Buyer | Sale Price | Title Company |
|---|---|---|---|
| Torres Emilio | -- | None Available | |
| Torres Emilio | -- | None Available | |
| Torres Emilianc | $131,789 | -- | |
| Torres Emilianc | $131,789 | -- | |
| Washington Mutual Bk | $303,306 | -- | |
| Washington Mutual Bk | $303,306 | -- | |
| Kenez Robert E | $159,500 | -- | |
| Kenez Robert E | $159,500 | -- |
Source: Public Records
Mortgage History
| Date | Status | Borrower | Loan Amount |
|---|---|---|---|
| Previous Owner | Kenez Robert E | $203,500 | |
| Previous Owner | Kenez Robert E | $290,500 |
Source: Public Records
Tax History Compared to Growth
Tax History
| Year | Tax Paid | Tax Assessment Tax Assessment Total Assessment is a certain percentage of the fair market value that is determined by local assessors to be the total taxable value of land and additions on the property. | Land | Improvement |
|---|---|---|---|---|
| 2025 | $9,372 | $392,140 | $98,530 | $293,610 |
| 2024 | $9,233 | $392,140 | $98,530 | $293,610 |
| 2023 | $7,666 | $305,600 | $90,310 | $215,290 |
| 2022 | $7,501 | $305,600 | $90,310 | $215,290 |
| 2021 | $7,325 | $305,600 | $90,310 | $215,290 |
| 2020 | $7,321 | $305,600 | $90,310 | $215,290 |
| 2019 | $7,125 | $305,600 | $90,310 | $215,290 |
| 2018 | $4,962 | $186,500 | $87,890 | $98,610 |
| 2017 | $4,790 | $186,500 | $87,890 | $98,610 |
| 2016 | $4,745 | $186,500 | $87,890 | $98,610 |
| 2015 | $4,732 | $186,500 | $87,890 | $98,610 |
| 2014 | $4,670 | $186,500 | $87,890 | $98,610 |
Source: Public Records
Map
Nearby Homes
- 28 Chestnut St
- 52 Lexington Ave
- 58 Shorefront Park
- 15 Madison St Unit F9
- 15 Madison St Unit G11
- 94 Washington St Unit 20
- 18 Soundview Ave
- 134 Washington St Unit 206
- 110 Washington St Unit 202
- 118 Washington St Unit 309
- 118 Washington St Unit 304
- 9 Observatory Place Unit A
- 41 Baxter Dr
- 83 Washington St Unit STE 2C
- 187 Flax Hill Rd Unit D5
- 187 Flax Hill Rd Unit A4
- 135 Flax Hill Rd Unit 21
- 16 Hillside Place Unit J4
- 16 Hillside Place Unit M5
- 47 Glasser St