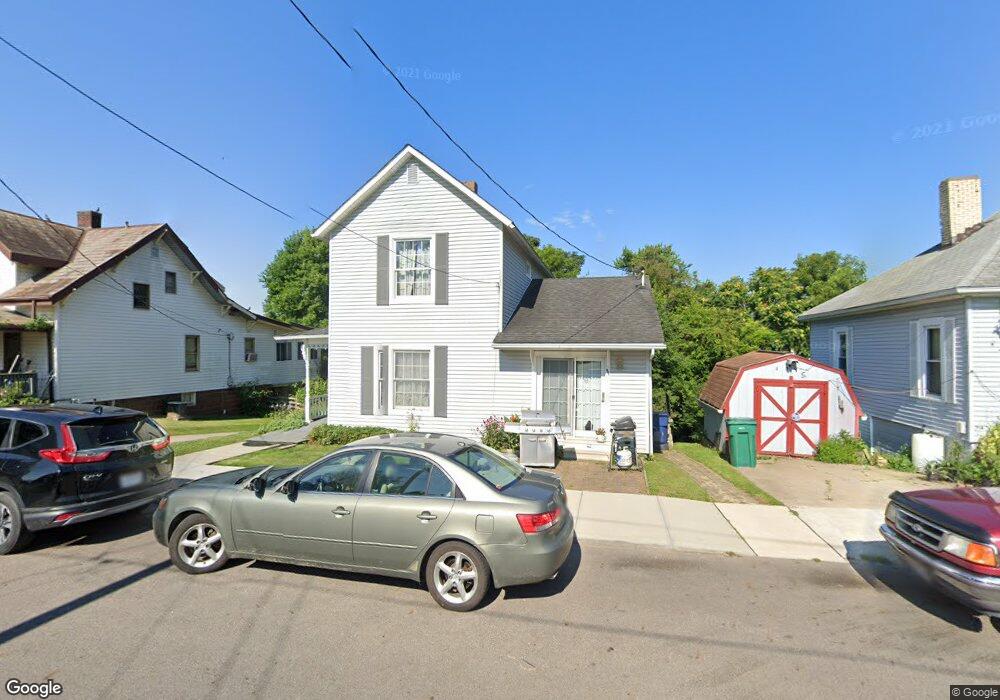
136 S Maple Heights New Lexington, OH 43764
Estimated Value: $87,000 - $161,762
1
Bed
2
Baths
1,408
Sq Ft
$78/Sq Ft
Est. Value
About This Home
This home is located at 136 S Maple Heights, New Lexington, OH 43764 and is currently estimated at $109,941, approximately $78 per square foot. 136 S Maple Heights is a home located in Perry County with nearby schools including New Lexington Elementary School, Junction City Elementary School, and New Lexington Middle School.
Ownership History
Date
Name
Owned For
Owner Type
Purchase Details
Closed on
May 28, 2025
Sold by
Nash Troy D
Bought by
Clear Note Llc
Current Estimated Value
Home Financials for this Owner
Home Financials are based on the most recent Mortgage that was taken out on this home.
Original Mortgage
$93,000
Outstanding Balance
$70,334
Interest Rate
6.76%
Mortgage Type
Construction
Estimated Equity
$39,607
Purchase Details
Closed on
Jan 23, 2025
Sold by
Kilbarger Seth A and Kilbarger Nakeya M
Bought by
Nash Troy D
Purchase Details
Closed on
Aug 26, 2019
Sold by
Self Brian and Kilbarger Robert
Bought by
Kilbarger Seth A and Kilbarger Nakeya M
Home Financials for this Owner
Home Financials are based on the most recent Mortgage that was taken out on this home.
Original Mortgage
$66,161
Interest Rate
3.7%
Mortgage Type
USDA
Create a Home Valuation Report for This Property
The Home Valuation Report is an in-depth analysis detailing your home's value as well as a comparison with similar homes in the area
Home Values in the Area
Average Home Value in this Area
Purchase History
| Date | Buyer | Sale Price | Title Company |
|---|---|---|---|
| Clear Note Llc | $89,000 | None Listed On Document | |
| Clear Note Llc | $89,000 | None Listed On Document | |
| Nash Troy D | $70,000 | Southern Title Of Ohio Ltd | |
| Nash Troy D | $70,000 | Southern Title Of Ohio Ltd | |
| Kilbarger Seth A | $65,500 | Valmer Land Title Agency Box |
Source: Public Records
Mortgage History
| Date | Status | Borrower | Loan Amount |
|---|---|---|---|
| Open | Clear Note Llc | $93,000 | |
| Closed | Clear Note Llc | $93,000 | |
| Previous Owner | Kilbarger Seth A | $66,161 |
Source: Public Records
Tax History Compared to Growth
Tax History
| Year | Tax Paid | Tax Assessment Tax Assessment Total Assessment is a certain percentage of the fair market value that is determined by local assessors to be the total taxable value of land and additions on the property. | Land | Improvement |
|---|---|---|---|---|
| 2024 | $1,714 | $37,880 | $4,290 | $33,590 |
| 2023 | $1,714 | $37,880 | $4,290 | $33,590 |
| 2022 | $1,418 | $33,520 | $4,180 | $29,340 |
| 2021 | $1,349 | $33,520 | $4,180 | $29,340 |
| 2020 | $1,310 | $33,520 | $4,180 | $29,340 |
| 2019 | $1,145 | $29,050 | $3,900 | $25,150 |
| 2018 | $800 | $29,050 | $3,900 | $25,150 |
| 2017 | $681 | $29,050 | $3,900 | $25,150 |
| 2016 | $581 | $23,350 | $2,890 | $20,460 |
| 2015 | $576 | $23,350 | $2,890 | $20,460 |
| 2014 | $863 | $23,350 | $2,890 | $20,460 |
| 2013 | $543 | $23,350 | $2,890 | $20,460 |
| 2012 | -- | $23,350 | $2,890 | $20,460 |
Source: Public Records
Map
Nearby Homes
- 398 North Ave
- 105 S Maple Heights
- 227 Park Ave
- 263 S Maple Heights
- 218 Park Ave
- 1893 Lovers Ln
- 500 Eastern Ave
- 200 N Main St
- 211 S High St
- 604 Orchard Ave
- 139 E Jefferson St
- 314 W Brown St
- 522 S Main St
- 403 Fowlers Ln
- 318 N Pleasant St
- 411 Fowlers Ln
- 524 Shawnee St
- 551 W Brown St
- 221 W Broadway St
- 603 Shawnee St
- 140 S Maple Heights
- 134 S Maple Heights
- 144 S Maple Heights
- 392 North Ave
- 148 S Maple Heights
- 391 Park Ave
- 391 Park Ave
- 394 North Ave
- 120 S Maple Heights
- 137 S Maple Heights
- 133 S Maple Heights
- 396 North Ave
- 200 S Maple Heights
- 398 Park Ave
- 127 S Maple Heights
- 118 S Maple Heights
- 385 Park Ave
- 202 S Maple Heights
- 123 S Maple Heights
- 201 S Maple Heights