Estimated Value: $358,000 - $406,927
3
Beds
3
Baths
1,745
Sq Ft
$218/Sq Ft
Est. Value
About This Home
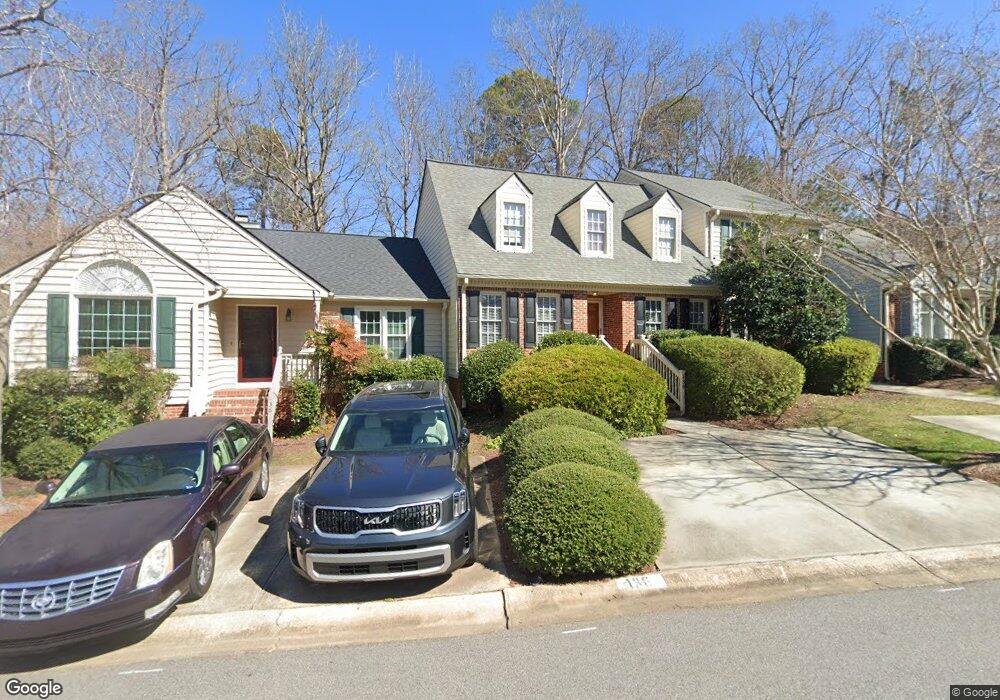
This home is located at 136 Sanair Ct, Apex, NC 27502 and is currently estimated at $380,232, approximately $217 per square foot. 136 Sanair Ct is a home located in Wake County with nearby schools including Apex Elementary School, Apex Middle, and Apex High School.
Ownership History
Date
Name
Owned For
Owner Type
Purchase Details
Closed on
Nov 6, 2019
Sold by
Taylor Michael and Taylor Catherine
Bought by
Farrell Megan Elizabeth and Sather Robert Marshall
Current Estimated Value
Home Financials for this Owner
Home Financials are based on the most recent Mortgage that was taken out on this home.
Original Mortgage
$223,250
Outstanding Balance
$196,403
Interest Rate
3.6%
Mortgage Type
New Conventional
Estimated Equity
$183,829
Purchase Details
Closed on
Sep 27, 2011
Sold by
Elias Lucylle
Bought by
Taylor Michael and Taylor Catherine
Home Financials for this Owner
Home Financials are based on the most recent Mortgage that was taken out on this home.
Original Mortgage
$158,300
Interest Rate
4.24%
Mortgage Type
VA
Purchase Details
Closed on
Aug 29, 2000
Sold by
Milano Lucia
Bought by
Elias Lucylle
Home Financials for this Owner
Home Financials are based on the most recent Mortgage that was taken out on this home.
Original Mortgage
$105,000
Interest Rate
8.24%
Create a Home Valuation Report for This Property
The Home Valuation Report is an in-depth analysis detailing your home's value as well as a comparison with similar homes in the area
Home Values in the Area
Average Home Value in this Area
Purchase History
| Date | Buyer | Sale Price | Title Company |
|---|---|---|---|
| Farrell Megan Elizabeth | $238,500 | None Available | |
| Taylor Michael | $155,000 | None Available | |
| Elias Lucylle | $136,000 | -- |
Source: Public Records
Mortgage History
| Date | Status | Borrower | Loan Amount |
|---|---|---|---|
| Open | Farrell Megan Elizabeth | $223,250 | |
| Previous Owner | Taylor Michael | $158,300 | |
| Previous Owner | Elias Lucylle | $105,000 |
Source: Public Records
Tax History Compared to Growth
Tax History
| Year | Tax Paid | Tax Assessment Tax Assessment Total Assessment is a certain percentage of the fair market value that is determined by local assessors to be the total taxable value of land and additions on the property. | Land | Improvement |
|---|---|---|---|---|
| 2025 | $3,218 | $366,296 | $140,000 | $226,296 |
| 2024 | $3,146 | $366,296 | $140,000 | $226,296 |
| 2023 | $2,644 | $239,214 | $75,000 | $164,214 |
| 2022 | $2,483 | $239,214 | $75,000 | $164,214 |
| 2021 | $2,388 | $239,214 | $75,000 | $164,214 |
| 2020 | $2,364 | $239,214 | $75,000 | $164,214 |
| 2019 | $1,969 | $171,612 | $47,000 | $124,612 |
| 2018 | $1,855 | $171,612 | $47,000 | $124,612 |
| 2017 | $1,728 | $171,612 | $47,000 | $124,612 |
| 2016 | $1,703 | $171,612 | $47,000 | $124,612 |
| 2015 | $1,618 | $159,038 | $34,000 | $125,038 |
| 2014 | -- | $159,038 | $34,000 | $125,038 |
Source: Public Records
Map
Nearby Homes
- 4006 New Yarmouth Way
- 1106 Wellstone Cir
- 1002 Eastham Dr
- 1000 Oakgate Ct
- 1003 Sunny Brae Ct
- 3007 Old Raleigh Rd
- 903 Norwood Ln
- 635 Sawcut Ln
- 631 Sawcut Ln
- 633 Sawcut Ln
- 3015 Old Raleigh Rd
- 596 Grand Central Station
- 295 Williams Grove Ln Unit Lot 67
- 214 Williams Grove Ln Unit Lot 4
- 218 Williams Grove Ln
- 226 Williams Grove Ln
- 262 Williams Grove Ln Unit Lot 76
- 268 Williams Grove Ln Unit Lot 75
- 278 Williams Grove Ln Unit Lot 73
- 286 Williams Grove Ln Unit Lot 71