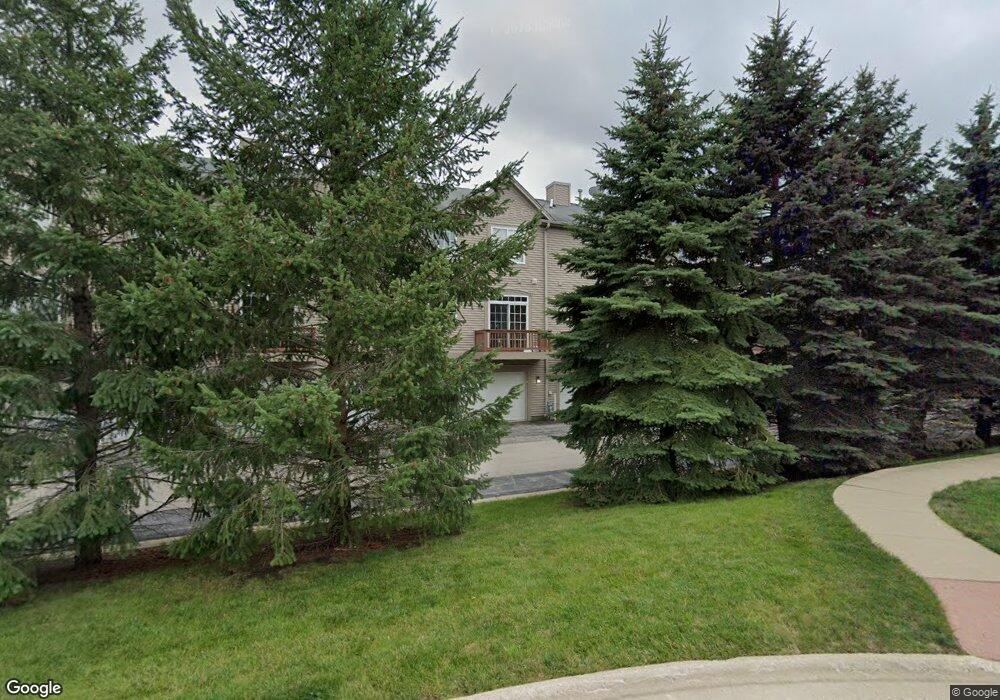
136 Station Park Cir Unit C Grayslake, IL 60030
Estimated Value: $295,000 - $350,000
3
Beds
3
Baths
1,808
Sq Ft
$180/Sq Ft
Est. Value
About This Home
This home is located at 136 Station Park Cir Unit C, Grayslake, IL 60030 and is currently estimated at $325,718, approximately $180 per square foot. 136 Station Park Cir Unit C is a home located in Lake County with nearby schools including Prairieview School, Frederick School, and Grayslake Middle School.
Ownership History
Date
Name
Owned For
Owner Type
Purchase Details
Closed on
Nov 28, 2023
Sold by
Tapia Salvador and Tapia Myra
Bought by
Ghani Feroza
Current Estimated Value
Purchase Details
Closed on
Aug 18, 2018
Sold by
Lee Susan J
Bought by
Tapia Salvador and Tapia Myra
Home Financials for this Owner
Home Financials are based on the most recent Mortgage that was taken out on this home.
Original Mortgage
$148,117
Interest Rate
4.5%
Mortgage Type
VA
Purchase Details
Closed on
May 24, 2005
Sold by
Village Station Grayslake Llc
Bought by
Lee Susan J
Home Financials for this Owner
Home Financials are based on the most recent Mortgage that was taken out on this home.
Original Mortgage
$152,925
Interest Rate
5.12%
Mortgage Type
Unknown
Create a Home Valuation Report for This Property
The Home Valuation Report is an in-depth analysis detailing your home's value as well as a comparison with similar homes in the area
Home Values in the Area
Average Home Value in this Area
Purchase History
| Date | Buyer | Sale Price | Title Company |
|---|---|---|---|
| Ghani Feroza | $210,000 | None Listed On Document | |
| Tapia Salvador | $145,000 | Chicago Title | |
| Lee Susan J | $223,000 | Chicago Title |
Source: Public Records
Mortgage History
| Date | Status | Borrower | Loan Amount |
|---|---|---|---|
| Previous Owner | Tapia Salvador | $148,117 | |
| Previous Owner | Lee Susan J | $152,925 |
Source: Public Records
Tax History Compared to Growth
Tax History
| Year | Tax Paid | Tax Assessment Tax Assessment Total Assessment is a certain percentage of the fair market value that is determined by local assessors to be the total taxable value of land and additions on the property. | Land | Improvement |
|---|---|---|---|---|
| 2024 | $8,536 | $79,079 | $7,513 | $71,566 |
| 2023 | $8,200 | $72,576 | $6,895 | $65,681 |
| 2022 | $8,200 | $68,371 | $10,244 | $58,127 |
| 2021 | $8,127 | $65,716 | $9,846 | $55,870 |
| 2020 | $8,154 | $62,527 | $9,368 | $53,159 |
| 2019 | $7,889 | $59,990 | $8,988 | $51,002 |
| 2018 | $7,121 | $54,344 | $4,201 | $50,143 |
| 2017 | $7,100 | $51,119 | $3,952 | $47,167 |
| 2016 | $6,860 | $47,188 | $3,648 | $43,540 |
| 2015 | $6,739 | $43,110 | $3,333 | $39,777 |
| 2014 | $6,232 | $39,851 | $5,978 | $33,873 |
| 2012 | $4,751 | $41,619 | $6,243 | $35,376 |
Source: Public Records
Map
Nearby Homes
- 231 Lionel Dr
- 228 Station Park Cir
- 270 Lionel Dr
- 42 Village Station Ln
- 102 Soo Line Dr
- 533 Cannon Ball Dr
- 10 Glen St
- 349 Brittain Ave
- Lot 48 Lake Ave
- 32100 Alleghany Rd
- 390 N Garfield Blvd
- 220 Bluff Ct
- 34110 S Circle Dr
- 121 Park Ave
- 146 Westerfield Place
- 26155 W Il Route 120
- 11 S Lake St
- 101 Burton St
- 230 N Alleghany Rd
- 337 Woodland Dr Unit 6
- 136 Station Park Cir
- 132 Station Park Cir
- 140 Station Park Cir
- 128 Station Park Cir
- 144 Station Park Cir
- 144 Station Park Cir Unit 144
- 000 Station Ln
- 620 Cannon Ball Dr
- 164 Station Park Cir
- 614 Station Park Cir
- 616 Cannon Ball Dr
- 168 Station Park Cir
- 110 Village Station Ln
- 612 Cannon Ball Dr
- 610 Station Park Cir
- 172 Station Park Cir
- 106 Village Station Ln
- 608 Cannon Ball Dr
- 606 Station Park Cir
- 176 Station Park Cir