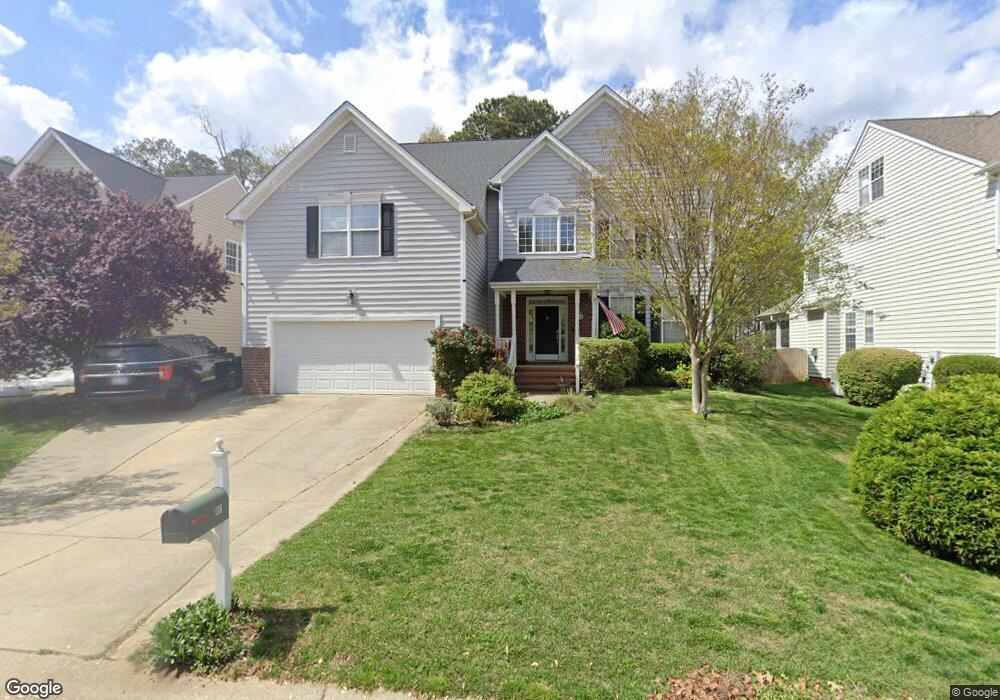
136 Sudano Ct Holly Springs, NC 27540
Estimated Value: $579,000 - $604,344
4
Beds
4
Baths
3,081
Sq Ft
$193/Sq Ft
Est. Value
About This Home
This home is located at 136 Sudano Ct, Holly Springs, NC 27540 and is currently estimated at $593,836, approximately $192 per square foot. 136 Sudano Ct is a home located in Wake County with nearby schools including Oakview Elementary School, Apex Friendship Middle School, and Holly Springs High School.
Ownership History
Date
Name
Owned For
Owner Type
Purchase Details
Closed on
Dec 12, 2007
Sold by
Chambers Kimberly
Bought by
Connelly Sean and Connelly Shannon
Current Estimated Value
Home Financials for this Owner
Home Financials are based on the most recent Mortgage that was taken out on this home.
Original Mortgage
$274,000
Outstanding Balance
$172,712
Interest Rate
6.22%
Mortgage Type
Purchase Money Mortgage
Estimated Equity
$421,124
Purchase Details
Closed on
Jun 21, 2005
Sold by
Parker & Orleans Homebuilders Inc
Bought by
Chambers Kimberly
Home Financials for this Owner
Home Financials are based on the most recent Mortgage that was taken out on this home.
Original Mortgage
$27,850
Interest Rate
5.66%
Mortgage Type
Credit Line Revolving
Purchase Details
Closed on
Mar 11, 2003
Sold by
Oakhall Lp
Bought by
Parker & Orleans Homebuilders Inc
Create a Home Valuation Report for This Property
The Home Valuation Report is an in-depth analysis detailing your home's value as well as a comparison with similar homes in the area
Home Values in the Area
Average Home Value in this Area
Purchase History
| Date | Buyer | Sale Price | Title Company |
|---|---|---|---|
| Connelly Sean | $274,000 | None Available | |
| Chambers Kimberly | $279,000 | -- | |
| Parker & Orleans Homebuilders Inc | $370,000 | -- |
Source: Public Records
Mortgage History
| Date | Status | Borrower | Loan Amount |
|---|---|---|---|
| Open | Connelly Sean | $274,000 | |
| Previous Owner | Chambers Kimberly | $27,850 | |
| Previous Owner | Chambers Kimberly | $223,150 |
Source: Public Records
Tax History Compared to Growth
Tax History
| Year | Tax Paid | Tax Assessment Tax Assessment Total Assessment is a certain percentage of the fair market value that is determined by local assessors to be the total taxable value of land and additions on the property. | Land | Improvement |
|---|---|---|---|---|
| 2025 | $4,850 | $561,264 | $120,000 | $441,264 |
| 2024 | $4,830 | $561,264 | $120,000 | $441,264 |
| 2023 | $3,848 | $354,899 | $37,500 | $317,399 |
| 2022 | $3,715 | $354,899 | $37,500 | $317,399 |
| 2021 | $3,646 | $354,899 | $37,500 | $317,399 |
| 2020 | $3,646 | $354,899 | $37,500 | $317,399 |
| 2019 | $3,378 | $279,130 | $36,000 | $243,130 |
| 2018 | $3,054 | $279,130 | $36,000 | $243,130 |
| 2017 | $2,944 | $279,130 | $36,000 | $243,130 |
| 2016 | $2,903 | $279,130 | $36,000 | $243,130 |
| 2015 | $3,173 | $300,415 | $48,000 | $252,415 |
| 2014 | $3,063 | $300,415 | $48,000 | $252,415 |
Source: Public Records
Map
Nearby Homes
- 105 Townsgate Ct
- 725 Little Leaf Ct
- 713 Littleleaf Ct
- 109 Bright Shade Ct
- 108 Crabwall Ct
- 761 W Holly Springs Rd
- 755 W Holly Springs Rd
- 749 W Holly Springs Rd
- 743 W Holly Springs Rd
- 737 W Holly Springs Rd
- 717 Starkland Way
- 225 Douglas St
- 321 Blalock St
- 329 N Main St
- 124 Cliffdale Rd
- 112 Burt St
- 126 Tuska Hills Dr
- 321 Cross Hill Ln
- 318 Blalock St
- 105 Cross Hill Ln