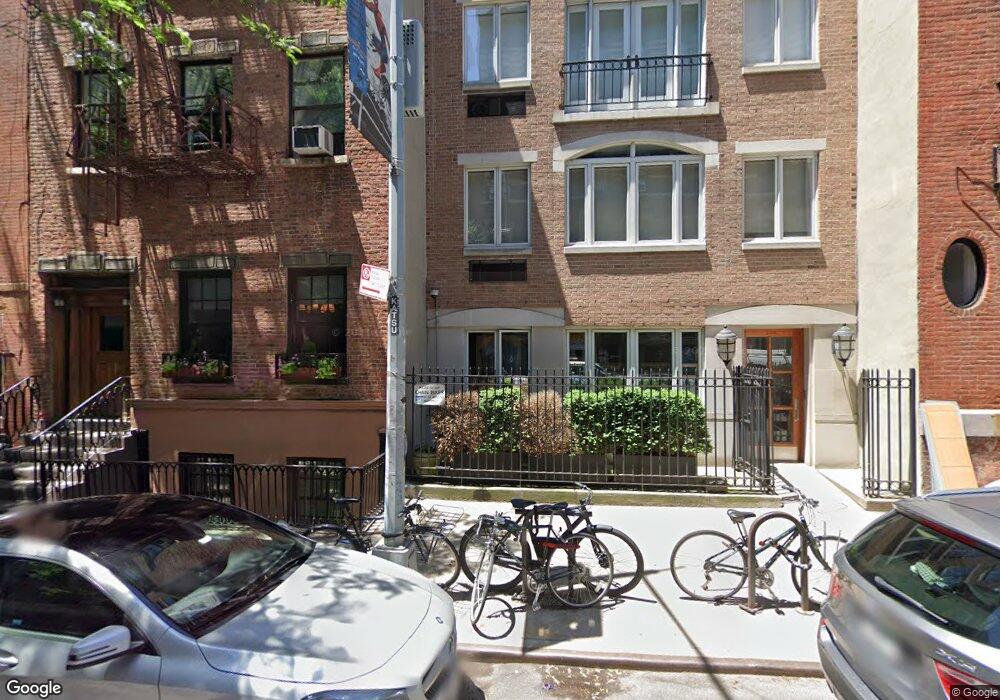
136 Sullivan St Unit 6 New York, NY 10012
SoHo NeighborhoodEstimated Value: $3,075,000 - $4,029,000
--
Bed
--
Bath
1,652
Sq Ft
$2,247/Sq Ft
Est. Value
About This Home
This home is located at 136 Sullivan St Unit 6, New York, NY 10012 and is currently estimated at $3,712,421, approximately $2,247 per square foot. 136 Sullivan St Unit 6 is a home located in New York County with nearby schools including P.S. 3 Charrette School, Middle School 297, and Clinton School.
Ownership History
Date
Name
Owned For
Owner Type
Purchase Details
Closed on
Jun 23, 2005
Sold by
The Michael Watt Voluntary Settlement
Bought by
Fitzgerald Dennis Lang
Current Estimated Value
Home Financials for this Owner
Home Financials are based on the most recent Mortgage that was taken out on this home.
Original Mortgage
$1,500,000
Interest Rate
5.71%
Mortgage Type
Purchase Money Mortgage
Purchase Details
Closed on
Jun 23, 1998
Sold by
Cahan Adam
Bought by
Kluge Samantha
Purchase Details
Closed on
Jan 9, 1997
Sold by
First Sullivan St Tenants Corp
Bought by
Kluge Samantha and Cahan Adam
Home Financials for this Owner
Home Financials are based on the most recent Mortgage that was taken out on this home.
Original Mortgage
$200,000
Interest Rate
7.8%
Create a Home Valuation Report for This Property
The Home Valuation Report is an in-depth analysis detailing your home's value as well as a comparison with similar homes in the area
Home Values in the Area
Average Home Value in this Area
Purchase History
| Date | Buyer | Sale Price | Title Company |
|---|---|---|---|
| Fitzgerald Dennis Lang | $2,550,000 | -- | |
| Fitzgerald Dennis Lang | $2,550,000 | -- | |
| Kluge Samantha | $200,000 | Title Associates Inc | |
| Kluge Samantha | $200,000 | Title Associates Inc | |
| Kluge Samantha | $814,500 | -- | |
| Kluge Samantha | $814,500 | -- |
Source: Public Records
Mortgage History
| Date | Status | Borrower | Loan Amount |
|---|---|---|---|
| Open | Fitzgerald Dennis Lang | $500,000 | |
| Closed | Fitzgerald Dennis Lang | $500,000 | |
| Previous Owner | Fitzgerald Dennis Lang | $1,500,000 | |
| Previous Owner | Kluge Samantha | $200,000 |
Source: Public Records
Tax History Compared to Growth
Tax History
| Year | Tax Paid | Tax Assessment Tax Assessment Total Assessment is a certain percentage of the fair market value that is determined by local assessors to be the total taxable value of land and additions on the property. | Land | Improvement |
|---|---|---|---|---|
| 2025 | $45,037 | $389,060 | $25,849 | $363,211 |
| 2024 | $45,037 | $360,242 | $54,400 | $338,985 |
| 2023 | $33,757 | $333,558 | $23,619 | $309,939 |
| 2022 | $32,406 | $832,212 | $54,400 | $777,812 |
| 2021 | $39,383 | $665,792 | $54,400 | $611,392 |
| 2020 | $30,796 | $699,431 | $54,400 | $645,031 |
| 2019 | $28,833 | $718,305 | $54,400 | $663,905 |
| 2018 | $32,635 | $256,583 | $21,610 | $234,973 |
| 2017 | $31,411 | $246,962 | $23,525 | $223,437 |
| 2016 | $31,838 | $246,962 | $25,946 | $221,016 |
| 2015 | $17,336 | $230,213 | $25,608 | $204,605 |
| 2014 | $17,336 | $213,161 | $19,752 | $193,409 |
Source: Public Records
Map
Nearby Homes
- 195 Prince St Unit 1LL
- 203 Prince St
- 44 Macdougal St
- 200 6th Ave
- 210 6th Ave Unit 3-G
- 196 6th Ave Unit 1A
- 54 Macdougal St Unit 1
- 145 Sullivan St Unit 3C
- 131 Thompson St Unit 6F
- 64 Macdougal St Unit 22
- 180 6th Ave Unit 5 A
- 11 Charlton St Unit 1A
- 2 Charlton St Unit PH16F
- 2 Charlton St Unit 4C
- 2 Charlton St Unit 10F
- 2 Charlton St Unit 9B
- 2 Charlton St Unit 9E
- 478 W Broadway Unit 4-N
- 426 W Broadway Unit 5G
- 185 W Houston St Unit 3C
- 136 Sullivan St
- 136 Sullivan St Unit ID1026165P
- 136 Sullivan St Unit 5
- 136 Sullivan St Unit 4
- 136 Sullivan St Unit 3
- 136 Sullivan St Unit 2
- 136 Sullivan St Unit 1
- 136 Sullivan St
- 134 Sullivan St Unit PARLOR
- 134 Sullivan St Unit 2
- 134 Sullivan St Unit 3-FLR
- 138 Sullivan St Unit GARDEN
- 138 Sullivan St Unit STORE
- 138 Sullivan St Unit TH
- 138 Sullivan St Unit 3
- 138 Sullivan St Unit 2
- 138 Sullivan St Unit 1
- 138 Sullivan St
- 140 Sullivan St
- 140 Sullivan St Unit 1-FLR