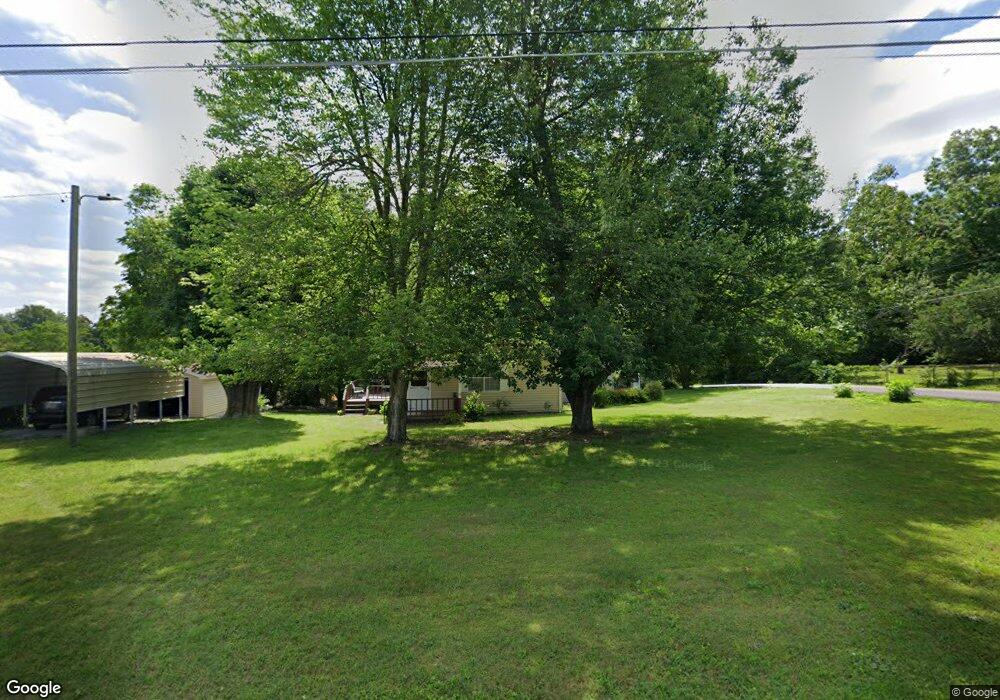
136 Summitt St Rossville, GA 30741
Estimated Value: $167,590 - $192,000
2
Beds
1
Bath
1,220
Sq Ft
$144/Sq Ft
Est. Value
About This Home
This home is located at 136 Summitt St, Rossville, GA 30741 and is currently estimated at $176,148, approximately $144 per square foot. 136 Summitt St is a home located in Walker County with nearby schools including Rossville Elementary School, Rossville Middle School, and Ridgeland High School.
Ownership History
Date
Name
Owned For
Owner Type
Purchase Details
Closed on
May 31, 2024
Sold by
Standifer Jerry B
Bought by
Horton Tracy D and Standifer Corey B
Current Estimated Value
Purchase Details
Closed on
May 8, 2008
Sold by
Not Provided
Bought by
Standifer Jerry B and Standifer
Home Financials for this Owner
Home Financials are based on the most recent Mortgage that was taken out on this home.
Original Mortgage
$40,000
Interest Rate
5.42%
Mortgage Type
New Conventional
Purchase Details
Closed on
Dec 5, 2000
Sold by
Owen Floyd and Owen Hazel N
Bought by
Owen Terry R and Owen Sheila B
Purchase Details
Closed on
Nov 24, 1997
Sold by
Mcclure Lorene C
Bought by
Owen Floyd and Owen Hazel N
Purchase Details
Closed on
May 22, 1989
Sold by
Pauline Fisher Dean
Bought by
Mcclure Lorene C
Purchase Details
Closed on
Jul 8, 1984
Sold by
Thompson Gene
Bought by
Pauline Fisher Dean
Purchase Details
Closed on
Jan 1, 1972
Bought by
Thompson Gene
Create a Home Valuation Report for This Property
The Home Valuation Report is an in-depth analysis detailing your home's value as well as a comparison with similar homes in the area
Home Values in the Area
Average Home Value in this Area
Purchase History
| Date | Buyer | Sale Price | Title Company |
|---|---|---|---|
| Horton Tracy D | -- | -- | |
| Standifer Jerry B | $71,000 | -- | |
| Owen Terry R | -- | -- | |
| Owen Floyd | $26,500 | -- | |
| Mcclure Lorene C | $31,500 | -- | |
| Pauline Fisher Dean | -- | -- | |
| Thompson Gene | -- | -- |
Source: Public Records
Mortgage History
| Date | Status | Borrower | Loan Amount |
|---|---|---|---|
| Previous Owner | Standifer Jerry B | $40,000 |
Source: Public Records
Tax History Compared to Growth
Tax History
| Year | Tax Paid | Tax Assessment Tax Assessment Total Assessment is a certain percentage of the fair market value that is determined by local assessors to be the total taxable value of land and additions on the property. | Land | Improvement |
|---|---|---|---|---|
| 2024 | $181 | $47,092 | $3,610 | $43,482 |
| 2023 | $182 | $44,701 | $3,610 | $41,091 |
| 2022 | $131 | $38,747 | $3,610 | $35,137 |
| 2021 | $131 | $26,074 | $2,527 | $23,547 |
| 2020 | $131 | $22,149 | $2,527 | $19,622 |
| 2019 | $131 | $22,149 | $2,527 | $19,622 |
| 2018 | $558 | $21,076 | $2,527 | $18,549 |
| 2017 | $134 | $21,076 | $2,527 | $18,549 |
| 2016 | $134 | $21,076 | $2,527 | $18,549 |
| 2015 | $135 | $24,603 | $2,904 | $21,699 |
| 2014 | $69 | $24,603 | $2,904 | $21,699 |
| 2013 | $558 | $24,603 | $2,904 | $21,699 |
Source: Public Records
Map
Nearby Homes
- 0 Summit St Unit 1514634
- 127 Summitt St
- 0 S Mission Ridge Dr Unit 1504695
- 71 Georgia Terrace
- 189 Leinbach Rd
- 39 Clift Trail
- 107 Lakeview Dr
- 0 Dempsey Ln Unit 1504691
- 3 Fox Chase St
- 317 Signal Dr
- 408 Hollywood Dr
- 301 Dempsey Ln
- 1 Fox Chase St
- 405 Andrews St
- 213 Alabama Ave
- 202 Tennessee Ave
- 216 Catoosa St
- 601 Chickamauga Ave
- 702 Short St
- 0 W Crest Rd Unit 1514944
- 329 Chambers St
- 126 Summitt St
- 137 Summitt St
- 137 Summitt St
- 137 Summitt St Unit Lot 24-25
- 202 Summitt St
- 400 Chambers St
- 328 Chambers St
- 328 Chambers St Unit 1
- 131 Summitt St
- 203 Summitt St
- 201 Summer St
- 131 Ridgecrest Cir
- 406 Chambers St
- 409 Chambers St
- 409 Chambers St Unit 409A
- 204 Summitt St
- 408 Chambers St
- 203 Summer St
- 205 Summitt St