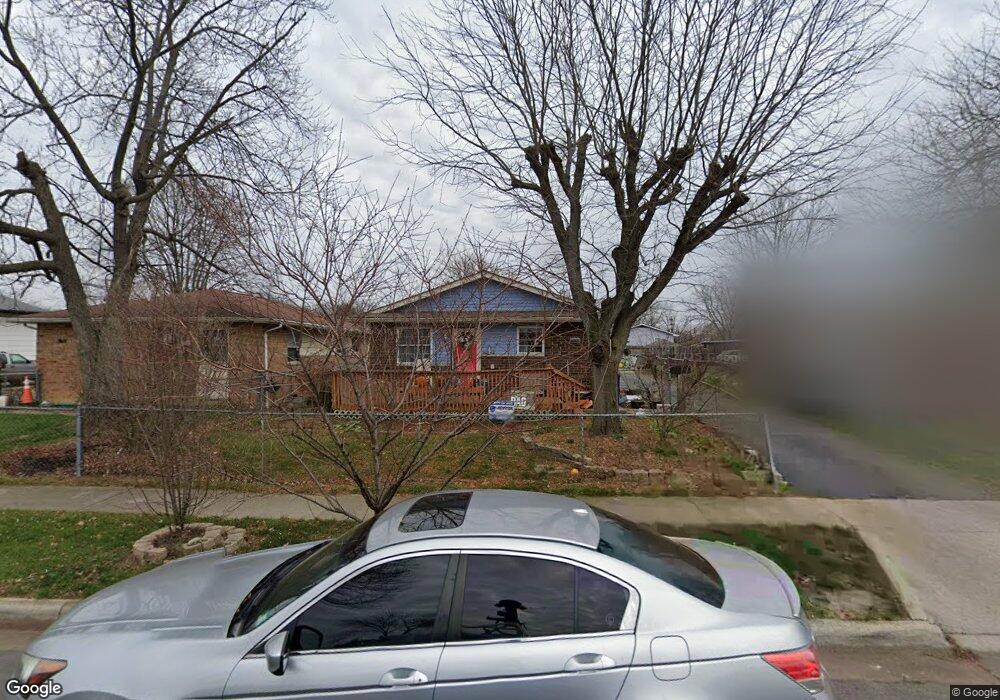
136 Tishman St Columbus, OH 43228
Estimated Value: $143,000 - $184,000
3
Beds
1
Bath
912
Sq Ft
$174/Sq Ft
Est. Value
About This Home
This home is located at 136 Tishman St, Columbus, OH 43228 and is currently estimated at $158,915, approximately $174 per square foot. 136 Tishman St is a home located in Franklin County with nearby schools including Eakin Elementary School, Wedgewood Middle School, and Briggs High School.
Ownership History
Date
Name
Owned For
Owner Type
Purchase Details
Closed on
Jul 22, 2017
Sold by
Romay Demetrio O
Bought by
Silva Floribeto Santigao
Current Estimated Value
Purchase Details
Closed on
Sep 14, 2010
Sold by
Secretary Of Housing & Urban Development
Bought by
Romay Demetrio O
Purchase Details
Closed on
Jun 15, 2010
Sold by
Gonzalez William M and Gonzalez Rosa Maria
Bought by
U S Bank Na
Purchase Details
Closed on
Apr 22, 2010
Sold by
U S Bank Na
Bought by
Secretary Of Housing & Urban Development
Purchase Details
Closed on
Sep 16, 1999
Sold by
Castle Gary A and Castle Fawn
Bought by
Gonzalez William M and Gonzalez Rosa Maria
Home Financials for this Owner
Home Financials are based on the most recent Mortgage that was taken out on this home.
Original Mortgage
$72,955
Interest Rate
7.93%
Mortgage Type
FHA
Purchase Details
Closed on
Dec 21, 1992
Create a Home Valuation Report for This Property
The Home Valuation Report is an in-depth analysis detailing your home's value as well as a comparison with similar homes in the area
Home Values in the Area
Average Home Value in this Area
Purchase History
| Date | Buyer | Sale Price | Title Company |
|---|---|---|---|
| Silva Floribeto Santigao | -- | None Available | |
| Romay Demetrio O | $22,000 | Attorney | |
| U S Bank Na | $44,000 | None Available | |
| Secretary Of Housing & Urban Development | -- | None Available | |
| Gonzalez William M | $73,000 | Stewart Title Agency Of Colu | |
| -- | -- | -- |
Source: Public Records
Mortgage History
| Date | Status | Borrower | Loan Amount |
|---|---|---|---|
| Previous Owner | Gonzalez William M | $72,955 |
Source: Public Records
Tax History Compared to Growth
Tax History
| Year | Tax Paid | Tax Assessment Tax Assessment Total Assessment is a certain percentage of the fair market value that is determined by local assessors to be the total taxable value of land and additions on the property. | Land | Improvement |
|---|---|---|---|---|
| 2024 | $3,153 | $47,040 | $8,750 | $38,290 |
| 2023 | $2,084 | $47,040 | $8,750 | $38,290 |
| 2022 | $1,295 | $24,960 | $8,050 | $16,910 |
| 2021 | $1,297 | $24,960 | $8,050 | $16,910 |
| 2020 | $1,299 | $24,960 | $8,050 | $16,910 |
| 2019 | $1,230 | $20,270 | $7,000 | $13,270 |
| 2018 | $1,255 | $20,270 | $7,000 | $13,270 |
| 2017 | $1,229 | $20,270 | $7,000 | $13,270 |
| 2016 | $1,412 | $21,320 | $5,290 | $16,030 |
| 2015 | $1,282 | $21,320 | $5,290 | $16,030 |
| 2014 | $1,285 | $21,320 | $5,290 | $16,030 |
| 2013 | $705 | $23,695 | $5,880 | $17,815 |
Source: Public Records
Map
Nearby Homes
- 147 Coolidge Ave
- 94 Florence Ave
- 139 Demorest Ave
- 3938 Halsey Place
- 4006 Halsey Place
- 638 Fairmoor Place
- 195 S Sylvan Ave
- 3831 Fairmoor Rd
- 644 Georgian Dr
- 38 Powhatan Ave
- 4202 Atlanta Dr
- 36-38 Orel Ave
- 743 Holly Hill Dr
- 133 S Brinker Ave
- 77 S Brinker Ave
- 776 Harwood Dr
- 99 N Brinker Ave Unit 101
- 3300-3302 Sullivant Ave
- 0 S Brinker Ave
- 139 Garden Heights Ave
- 130 Tishman St
- 144 Tishman St
- 124 Tishman St
- 137 Alice Rita St
- 143 Alice Rita St
- 129 Alice Rita St
- 116 Tishman St
- 156 Tishman St
- 149 Alice Rita St
- 123 Alice Rita St
- 135 Tishman St
- 141 Tishman St
- 129 Tishman St
- 117 Alice Rita St
- 157 Alice Rita St
- 149 Tishman St
- 110 Tishman St
- 162 Tishman St
- 123 Tishman St
- 157 Tishman St