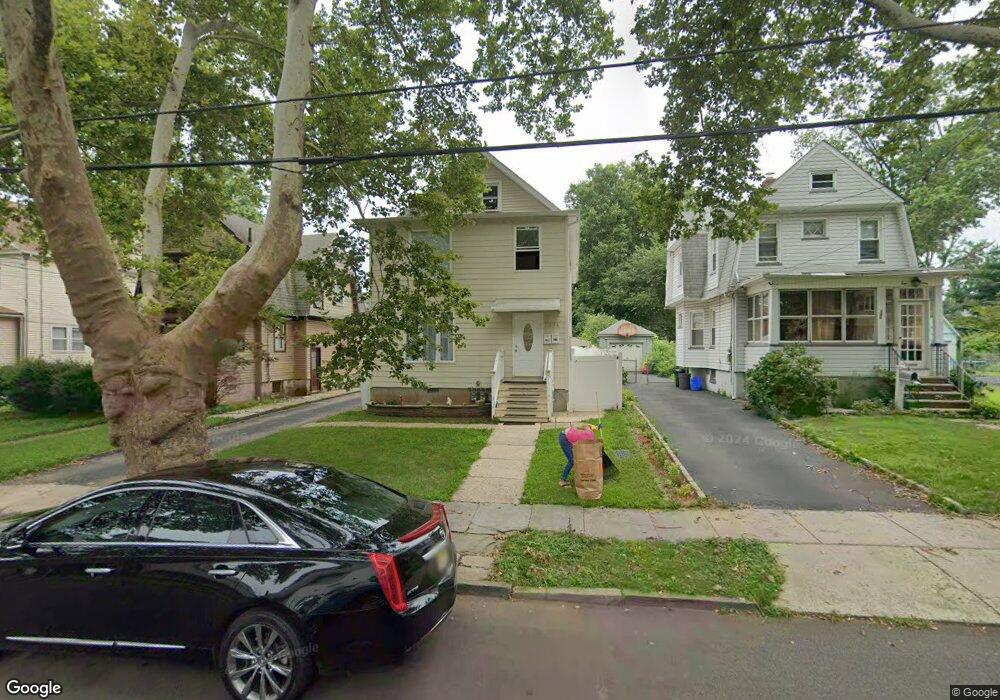
136 Union Rd Roselle Park, NJ 07204
Estimated Value: $591,000 - $670,000
--
Bed
--
Bath
2,602
Sq Ft
$236/Sq Ft
Est. Value
About This Home
This home is located at 136 Union Rd, Roselle Park, NJ 07204 and is currently estimated at $613,314, approximately $235 per square foot. 136 Union Rd is a home located in Union County with nearby schools including Roselle Park High School and St. Joseph the Carpenter School.
Ownership History
Date
Name
Owned For
Owner Type
Purchase Details
Closed on
Sep 16, 2008
Sold by
Fall Asset Management Llc
Bought by
Lopez Alfonso
Current Estimated Value
Home Financials for this Owner
Home Financials are based on the most recent Mortgage that was taken out on this home.
Original Mortgage
$277,981
Interest Rate
6.08%
Mortgage Type
FHA
Purchase Details
Closed on
Feb 13, 2007
Sold by
Mcgill Frank A and Mcgill Pamela
Bought by
Nomura Capital & Credit Inc
Purchase Details
Closed on
Feb 13, 2004
Sold by
Pfister Robert
Bought by
Mcgill Frank
Home Financials for this Owner
Home Financials are based on the most recent Mortgage that was taken out on this home.
Original Mortgage
$331,200
Interest Rate
5.65%
Purchase Details
Closed on
May 22, 2003
Sold by
Lipke Ronald
Bought by
Pfister Robert and Idrovo Ruth
Create a Home Valuation Report for This Property
The Home Valuation Report is an in-depth analysis detailing your home's value as well as a comparison with similar homes in the area
Home Values in the Area
Average Home Value in this Area
Purchase History
| Date | Buyer | Sale Price | Title Company |
|---|---|---|---|
| Lopez Alfonso | $289,000 | None Available | |
| Nomura Capital & Credit Inc | $349,700 | None Available | |
| Mcgill Frank | $368,000 | -- | |
| Pfister Robert | $303,500 | -- |
Source: Public Records
Mortgage History
| Date | Status | Borrower | Loan Amount |
|---|---|---|---|
| Previous Owner | Lopez Alfonso | $277,981 | |
| Previous Owner | Mcgill Frank | $331,200 |
Source: Public Records
Tax History Compared to Growth
Tax History
| Year | Tax Paid | Tax Assessment Tax Assessment Total Assessment is a certain percentage of the fair market value that is determined by local assessors to be the total taxable value of land and additions on the property. | Land | Improvement |
|---|---|---|---|---|
| 2025 | $12,534 | $283,500 | $88,400 | $195,100 |
| 2024 | $12,225 | $283,500 | $88,400 | $195,100 |
| 2023 | $12,225 | $283,500 | $88,400 | $195,100 |
| 2022 | $11,745 | $283,500 | $88,400 | $195,100 |
| 2021 | $11,663 | $283,500 | $88,400 | $195,100 |
| 2020 | $11,584 | $283,500 | $88,400 | $195,100 |
| 2019 | $11,436 | $283,500 | $88,400 | $195,100 |
| 2018 | $11,280 | $283,500 | $88,400 | $195,100 |
| 2017 | $11,153 | $283,500 | $88,400 | $195,100 |
| 2016 | $10,804 | $283,500 | $88,400 | $195,100 |
| 2015 | $12,133 | $89,300 | $29,700 | $59,600 |
| 2014 | $11,526 | $89,300 | $29,700 | $59,600 |
Source: Public Records
Map
Nearby Homes
- 315 Hemlock St
- 111 Avon St
- 219 Magie Ave
- 221 223 E 2nd Ave
- 173 E Webster Ave
- 221 Pershing Ave
- 214 Sherman Ave
- 362 E Clay Ave
- 118 E Lincoln Ave
- 105 Pershing Ave
- 302 E Lincoln Ave
- 108 110 Warren Ave
- 617 Sherman Ave
- 126 Butler Ave
- 322 Mercer Ave
- 326 Mercer Ave
- 133 W 3rd Ave
- 504 E Lincoln Ave
- 423 E 4th Ave
- 508 E Clay Ave