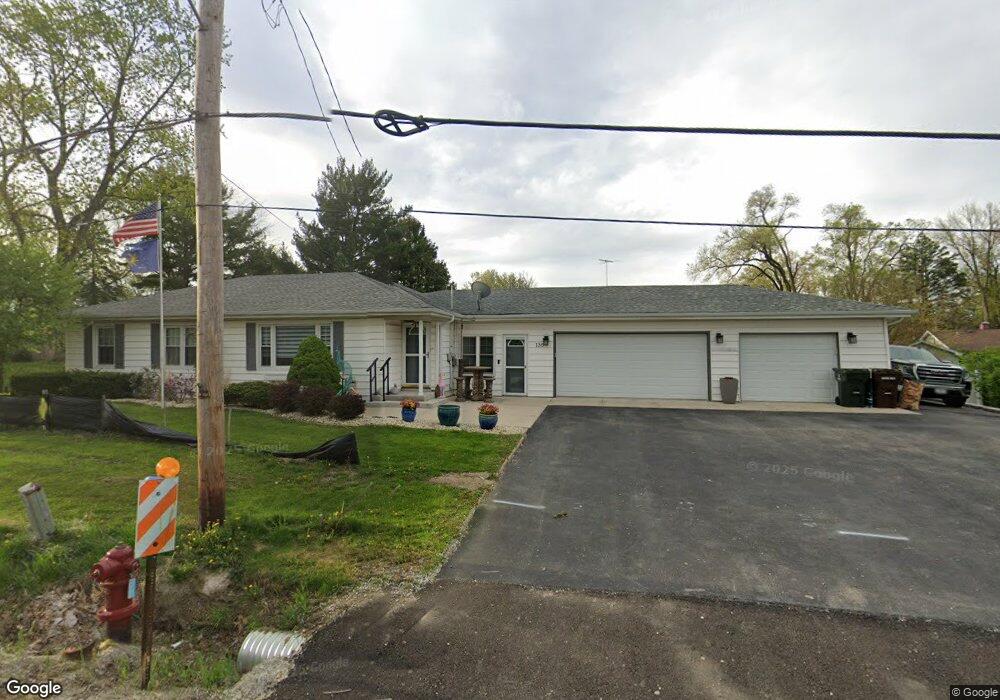
136 W Francis Rd New Lenox, IL 60451
Estimated Value: $316,011 - $356,000
--
Bed
--
Bath
--
Sq Ft
0.32
Acres
About This Home
This home is located at 136 W Francis Rd, New Lenox, IL 60451 and is currently estimated at $330,503. 136 W Francis Rd is a home located in Will County with nearby schools including Oster-Oakview School, Haines Elementary School, and Lincoln Way West.
Ownership History
Date
Name
Owned For
Owner Type
Purchase Details
Closed on
Nov 20, 2020
Sold by
Dykstra John A and Dykstra Judith A
Bought by
Mysliwiec Karen and Hutfilz Steven
Current Estimated Value
Home Financials for this Owner
Home Financials are based on the most recent Mortgage that was taken out on this home.
Original Mortgage
$180,000
Outstanding Balance
$160,174
Interest Rate
2.8%
Mortgage Type
New Conventional
Estimated Equity
$170,329
Purchase Details
Closed on
Jan 27, 2015
Sold by
Dykstra John A and Dykstra Judith A
Bought by
Dykstra Living Trust
Purchase Details
Closed on
Jun 18, 2011
Sold by
Meadows K Mark and Meadows Dinah
Bought by
Dykstra John A and Dykstra Judith A
Purchase Details
Closed on
Jun 14, 1996
Sold by
Wilmsen Judith K
Bought by
Meadows K Mark and Meadows Dinah
Home Financials for this Owner
Home Financials are based on the most recent Mortgage that was taken out on this home.
Original Mortgage
$104,000
Interest Rate
8.29%
Mortgage Type
Purchase Money Mortgage
Create a Home Valuation Report for This Property
The Home Valuation Report is an in-depth analysis detailing your home's value as well as a comparison with similar homes in the area
Home Values in the Area
Average Home Value in this Area
Purchase History
| Date | Buyer | Sale Price | Title Company |
|---|---|---|---|
| Mysliwiec Karen | $230,000 | None Available | |
| Dykstra Living Trust | -- | None Available | |
| Dykstra John A | $158,000 | Prism Title | |
| Meadows K Mark | $130,000 | Premier Title Company |
Source: Public Records
Mortgage History
| Date | Status | Borrower | Loan Amount |
|---|---|---|---|
| Open | Mysliwiec Karen | $180,000 | |
| Previous Owner | Meadows K Mark | $104,000 |
Source: Public Records
Tax History Compared to Growth
Tax History
| Year | Tax Paid | Tax Assessment Tax Assessment Total Assessment is a certain percentage of the fair market value that is determined by local assessors to be the total taxable value of land and additions on the property. | Land | Improvement |
|---|---|---|---|---|
| 2024 | $6,962 | $93,784 | $28,334 | $65,450 |
| 2023 | $6,962 | $85,492 | $25,829 | $59,663 |
| 2022 | $6,296 | $78,759 | $23,795 | $54,964 |
| 2021 | $5,966 | $74,070 | $22,378 | $51,692 |
| 2020 | $6,321 | $71,428 | $21,580 | $49,848 |
| 2019 | $6,061 | $69,213 | $20,911 | $48,302 |
| 2018 | $5,934 | $66,827 | $20,190 | $46,637 |
| 2017 | $5,649 | $64,906 | $19,610 | $45,296 |
| 2016 | $5,494 | $63,169 | $19,085 | $44,084 |
| 2015 | $5,304 | $61,180 | $18,484 | $42,696 |
| 2014 | $5,304 | $60,425 | $18,256 | $42,169 |
| 2013 | $5,304 | $61,239 | $18,502 | $42,737 |
Source: Public Records
Map
Nearby Homes
- 133 Barbara Ln
- 1231 Town Crest Dr Unit E
- 1344 N Cedar Rd
- 217 Aspen Dr
- 200 Redwood Ave
- 208 Redwood Ave
- 125 Kimber Dr
- 224 Hauser Ct
- 338 Willow St
- 203 Fir St
- 807 Picardy Place
- 331 Old Hickory Rd
- 1301 Silver Cross Blvd
- 1261 S Regan Rd
- Vacant W Maple St
- 416 Manor Ct Unit B
- 202 Hickory St
- 1999 Silver Cross Blvd
- 0 Silver Cross Blvd
- 1500 Ramp