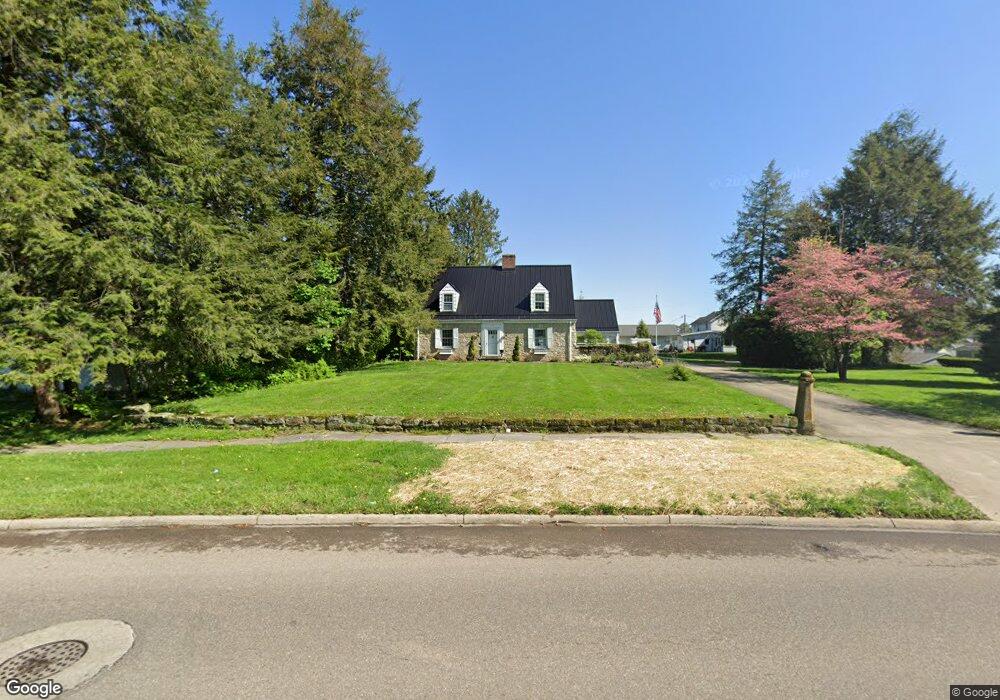
136 W Sandusky St Fredericktown, OH 43019
Estimated Value: $253,000 - $280,869
3
Beds
3
Baths
1,800
Sq Ft
$147/Sq Ft
Est. Value
About This Home
This home is located at 136 W Sandusky St, Fredericktown, OH 43019 and is currently estimated at $264,967, approximately $147 per square foot. 136 W Sandusky St is a home located in Knox County with nearby schools including Fredericktown Elementary School, Fredericktown Middle School, and Fredericktown High School.
Ownership History
Date
Name
Owned For
Owner Type
Purchase Details
Closed on
Mar 20, 2012
Sold by
Testa Melanne R and Acker Shad I
Bought by
Acker Melanne R and Acker Shad I
Current Estimated Value
Purchase Details
Closed on
Dec 1, 2006
Sold by
Testa Donald D
Bought by
Testa Melanne R
Home Financials for this Owner
Home Financials are based on the most recent Mortgage that was taken out on this home.
Original Mortgage
$115,500
Outstanding Balance
$69,132
Interest Rate
6.33%
Mortgage Type
New Conventional
Estimated Equity
$195,835
Purchase Details
Closed on
Aug 2, 2004
Bought by
Testa Donald D
Purchase Details
Closed on
Jan 15, 2004
Sold by
Testa Marilyn L and Testa Donald
Bought by
Testa Donald Tte Marilyn
Purchase Details
Closed on
Dec 29, 1998
Sold by
Testa Donald D and Testa Marilyn
Bought by
Testa Marilyn L and Testa Donald
Purchase Details
Closed on
Feb 8, 1990
Sold by
Grant Eugene F and Grant Elle
Bought by
Testa Donald D and Testa Marilyn
Create a Home Valuation Report for This Property
The Home Valuation Report is an in-depth analysis detailing your home's value as well as a comparison with similar homes in the area
Home Values in the Area
Average Home Value in this Area
Purchase History
| Date | Buyer | Sale Price | Title Company |
|---|---|---|---|
| Acker Melanne R | -- | None Available | |
| Testa Melanne R | $123,750 | None Available | |
| Testa Donald D | -- | -- | |
| Testa Donald Tte Marilyn | -- | -- | |
| Testa Marilyn L | -- | -- | |
| Testa Donald D | $78,000 | -- |
Source: Public Records
Mortgage History
| Date | Status | Borrower | Loan Amount |
|---|---|---|---|
| Open | Testa Melanne R | $115,500 |
Source: Public Records
Tax History Compared to Growth
Tax History
| Year | Tax Paid | Tax Assessment Tax Assessment Total Assessment is a certain percentage of the fair market value that is determined by local assessors to be the total taxable value of land and additions on the property. | Land | Improvement |
|---|---|---|---|---|
| 2024 | $2,711 | $66,220 | $18,810 | $47,410 |
| 2023 | $2,711 | $66,220 | $18,810 | $47,410 |
| 2022 | $2,137 | $45,670 | $12,970 | $32,700 |
| 2021 | $2,137 | $45,670 | $12,970 | $32,700 |
| 2020 | $2,106 | $45,670 | $12,970 | $32,700 |
| 2019 | $2,159 | $44,480 | $14,010 | $30,470 |
| 2018 | $2,107 | $44,480 | $14,010 | $30,470 |
| 2017 | $2,104 | $45,100 | $14,630 | $30,470 |
| 2016 | $1,960 | $41,770 | $13,550 | $28,220 |
| 2015 | $1,836 | $41,770 | $13,550 | $28,220 |
| 2014 | $1,839 | $41,770 | $13,550 | $28,220 |
| 2013 | $1,957 | $41,960 | $12,740 | $29,220 |
Source: Public Records
Map
Nearby Homes
- 65 W College St
- 191 Tuttle Ave
- 60 High St
- 29 W Sandusky St
- 53 Zent Ave
- 95 S Mulberry St
- 228 Taylor St
- 64 S Main St
- 69 Mount Vernon Ave
- 5 Arrowhead Dr
- 15 Crestview Dr
- 1 Freeway Ave
- 0 Upper Fredericktown Rd
- 11810 Woodview Ln
- 18245 Waterford Rd
- 0
- 0 Crooked Street Land Split 2
- 11936 Yankee St
- 0 Crooked St
- 140 W Sandusky St
- 122 W Sandusky St
- 133 W 2nd St
- Lot 3 W Sandusky St
- Lot 2 W Sandusky St
- Lot 1 W Sandusky St
- 0 W Sandusky St Unit Lot 1 216035447
- 0 W Sandusky St Unit Lot 2 216035453
- 0 W Sandusky St Unit Lot 3 216035459
- 0 W Sandusky St
- 134 W 2nd St
- 137 W Sandusky St
- 152 W Sandusky St
- 129 W Sandusky St
- 110 W Sandusky St
- 143 W Sandusky St
- 123 W Sandusky St
- 26 Carol Dr
- 26 Carol Dr
- 111 W Sandusky St