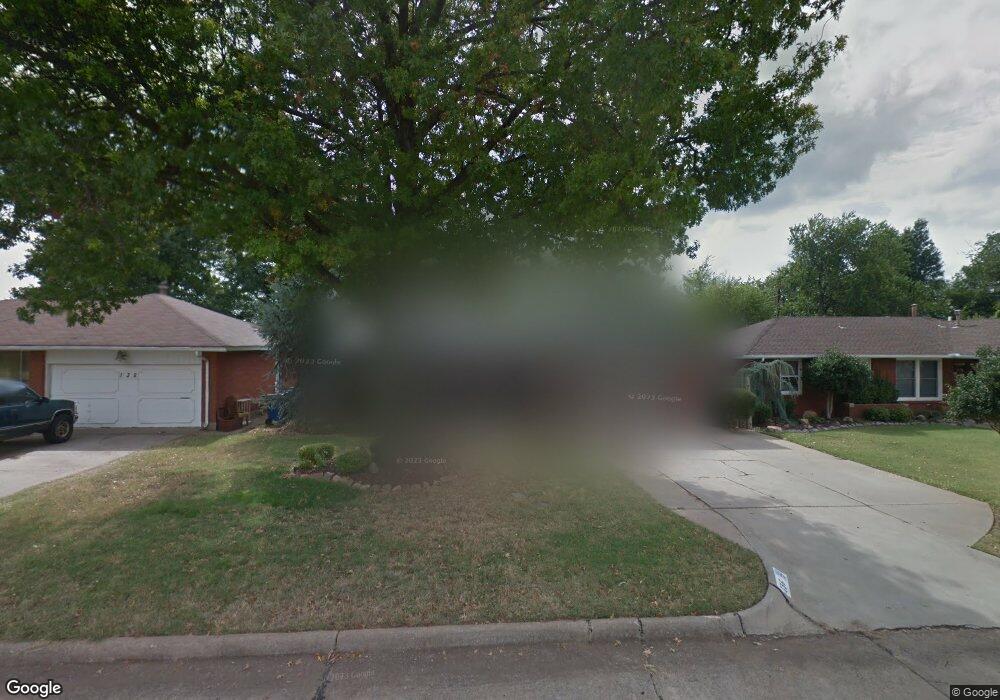
136 W Steed Dr Oklahoma City, OK 73110
Estimated Value: $153,000 - $174,000
3
Beds
2
Baths
1,053
Sq Ft
$155/Sq Ft
Est. Value
About This Home
This home is located at 136 W Steed Dr, Oklahoma City, OK 73110 and is currently estimated at $162,840, approximately $154 per square foot. 136 W Steed Dr is a home located in Oklahoma County with nearby schools including Country Estates Elementary School, Midwest City Middle School, and Midwest City High School.
Ownership History
Date
Name
Owned For
Owner Type
Purchase Details
Closed on
Sep 23, 2008
Sold by
Waller Laura H and Dunlap Chelsea M
Bought by
Chapman Renee M
Current Estimated Value
Home Financials for this Owner
Home Financials are based on the most recent Mortgage that was taken out on this home.
Original Mortgage
$70,000
Interest Rate
6.57%
Mortgage Type
Purchase Money Mortgage
Purchase Details
Closed on
May 25, 2006
Sold by
Waller Laura H
Bought by
Waller Laura H and Dunlap John T
Create a Home Valuation Report for This Property
The Home Valuation Report is an in-depth analysis detailing your home's value as well as a comparison with similar homes in the area
Home Values in the Area
Average Home Value in this Area
Purchase History
| Date | Buyer | Sale Price | Title Company |
|---|---|---|---|
| Chapman Renee M | $92,500 | American Guaranty Title Co | |
| Waller Laura H | -- | American Guaranty Title Co |
Source: Public Records
Mortgage History
| Date | Status | Borrower | Loan Amount |
|---|---|---|---|
| Closed | Chapman Renee M | $70,000 |
Source: Public Records
Tax History Compared to Growth
Tax History
| Year | Tax Paid | Tax Assessment Tax Assessment Total Assessment is a certain percentage of the fair market value that is determined by local assessors to be the total taxable value of land and additions on the property. | Land | Improvement |
|---|---|---|---|---|
| 2024 | $1,233 | $11,822 | $1,684 | $10,138 |
| 2023 | $1,233 | $11,478 | $1,266 | $10,212 |
| 2022 | $1,183 | $11,144 | $1,366 | $9,778 |
| 2021 | $1,173 | $10,820 | $1,554 | $9,266 |
| 2020 | $1,167 | $10,505 | $1,698 | $8,807 |
| 2019 | $1,107 | $10,423 | $1,466 | $8,957 |
| 2018 | $1,005 | $10,120 | $0 | $0 |
| 2017 | $1,009 | $10,009 | $1,524 | $8,485 |
| 2016 | $1,018 | $9,844 | $1,524 | $8,320 |
| 2015 | $1,053 | $9,786 | $1,627 | $8,159 |
| 2014 | $1,064 | $9,889 | $1,627 | $8,262 |
Source: Public Records
Map
Nearby Homes