Estimated Value: $107,286 - $174,000
2
Beds
1
Bath
1,232
Sq Ft
$116/Sq Ft
Est. Value
About This Home
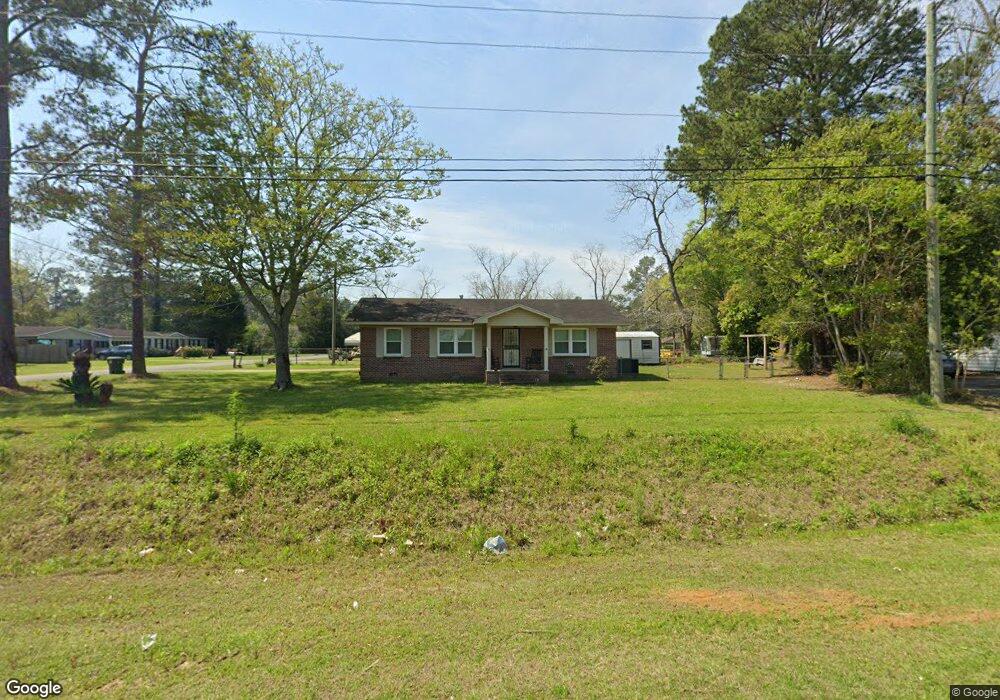
This home is located at 1360 5th St SE, Cairo, GA 39828 and is currently estimated at $142,322, approximately $115 per square foot. 1360 5th St SE is a home located in Grady County with nearby schools including Cairo High School.
Ownership History
Date
Name
Owned For
Owner Type
Purchase Details
Closed on
Sep 10, 2012
Sold by
Roberts Shelli Marie
Bought by
Department Of Transporation
Current Estimated Value
Purchase Details
Closed on
Jun 28, 2012
Sold by
Roberts Matthew Ryan
Bought by
Roberts Shelli Marie
Purchase Details
Closed on
Jun 22, 2005
Sold by
Donaldson Lyla H
Bought by
Donaldson Clifton E
Home Financials for this Owner
Home Financials are based on the most recent Mortgage that was taken out on this home.
Original Mortgage
$62,000
Interest Rate
5.57%
Mortgage Type
New Conventional
Purchase Details
Closed on
Dec 17, 2001
Sold by
Donaldson Bernard H
Bought by
Donaldson Lyla H
Purchase Details
Closed on
Sep 6, 2001
Sold by
Donaldson Lyla H
Bought by
Donaldson Bernard H
Purchase Details
Closed on
Jun 17, 1991
Bought by
Donaldson Lyla H
Create a Home Valuation Report for This Property
The Home Valuation Report is an in-depth analysis detailing your home's value as well as a comparison with similar homes in the area
Purchase History
| Date | Buyer | Sale Price | Title Company |
|---|---|---|---|
| Department Of Transporation | $15,500 | -- | |
| Roberts Shelli Marie | -- | -- | |
| Donaldson Clifton E | -- | -- | |
| Roberts Matthew Ryan | $60,000 | -- | |
| Donaldson Lyla H | -- | -- | |
| Donaldson Bernard H | -- | -- | |
| Donaldson Lyla H | $48,000 | -- |
Source: Public Records
Mortgage History
| Date | Status | Borrower | Loan Amount |
|---|---|---|---|
| Previous Owner | Roberts Matthew Ryan | $62,000 |
Source: Public Records
Tax History
| Year | Tax Paid | Tax Assessment Tax Assessment Total Assessment is a certain percentage of the fair market value that is determined by local assessors to be the total taxable value of land and additions on the property. | Land | Improvement |
|---|---|---|---|---|
| 2024 | $1,189 | $41,128 | $2,800 | $38,328 |
| 2023 | $1,215 | $34,497 | $4,649 | $29,848 |
| 2022 | $1,267 | $34,497 | $4,649 | $29,848 |
| 2021 | $1,270 | $34,497 | $4,649 | $29,848 |
| 2020 | $1,273 | $34,497 | $4,649 | $29,848 |
| 2019 | $1,273 | $34,497 | $4,649 | $29,848 |
| 2018 | $1,211 | $34,497 | $4,649 | $29,848 |
| 2017 | $1,165 | $34,497 | $4,649 | $29,848 |
| 2016 | $1,008 | $29,416 | $4,649 | $24,766 |
| 2015 | $999 | $29,416 | $4,649 | $24,766 |
| 2014 | $999 | $29,416 | $4,649 | $24,766 |
| 2013 | -- | $25,601 | $4,926 | $20,674 |
Source: Public Records
Map
Nearby Homes
- 1405 Platt Ave
- 1406 Platt Ave
- 530 6th St
- 306 Midland Place
- 198 Oakdale Rd SE
- 1193 S Broad St
- 130 17th Ave SE
- 530 6th Ave SE
- 112 Cakebread Dr
- 580 5th St SE
- 1870 Oakdale Rd SE
- 592 20th St SE
- 471 4th St SE
- 1891 Lakewood Dr SE
- 117 SW Pine Cirlce
- 112 Pine Cir SW
- 309 3rd St SE
- 140 Elderberry Ln
- 460 2nd St SW
- 0 111 Hwy Unit 396477
- 495 Ridgecrest Dr SE
- 1358 5th St SE Unit 1356
- 470 Ridgecrest Dr SE
- 1354 5th St SE Unit 1352
- 1351 Ben Hill Ave SE
- 1398 5th St SE
- 1365 5th St SE
- 1361 5th St SE
- 1341 Ben Hill Ave SE
- 1331 Ben Hill Ave SE
- 1405 Ga Highway 93 S
- 435 Maxwell Dr
- 1321 Ben Hill Ave SE
- 1390 Ben Hill Ave SE
- 448 Maxwell Dr
- 419 Ridgecrest Dr SE
- 442 Maxwell Dr
- 1356 Ben Hill Ave SE
- 1311 Ben Hill Ave SE
Your Personal Tour Guide
Ask me questions while you tour the home.