
Seller's Agent in 2018
Debra Mclean
My Home Group Real Estate
(480) 205-5979
2 in this area
93 Total Sales
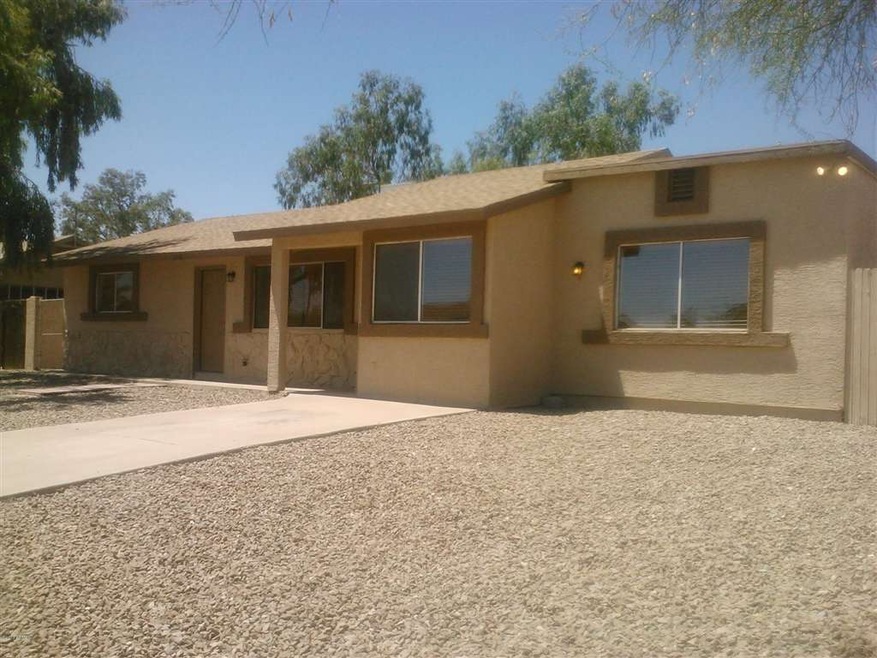
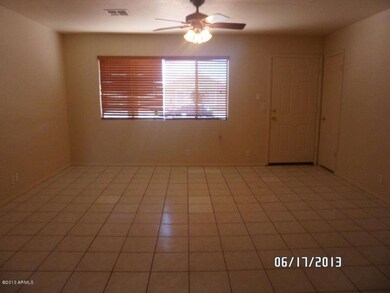
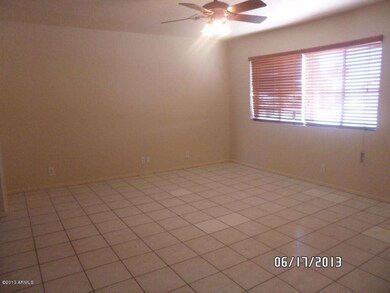
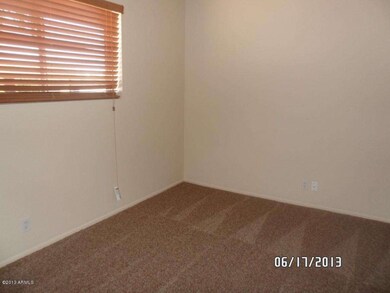
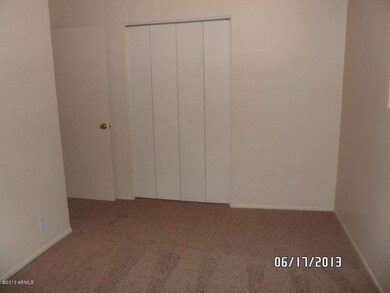
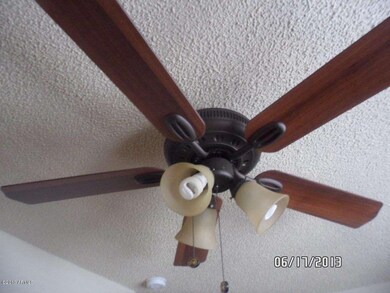
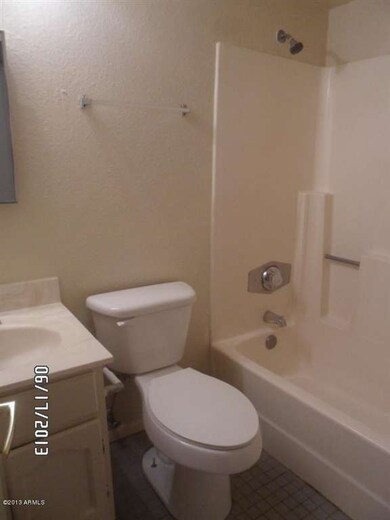
Price Reduced!! Fantastic remodel. House has 4 bedrooms with 2 baths and a open kitchen with dining area. Walk into the master suite off the dining area to find its own sitting room, wet bar, bathroom with huge shower and a separate sleeping area. This home has brand new roof, paint, carpet, blinds, fans, and fixtures throughout. Backyard is large and has an over-sized with stuccoed block fence and huge covered patio and RV gate. This is a must see!
Last Agent to Sell the Property
My Home Group Real Estate License #SA627357000 Listed on: 06/17/2013
| Date | Type | Sale Price | Title Company |
|---|---|---|---|
| Warranty Deed | $20,600 | Security Title Agency Inc | |
| Warranty Deed | $129,800 | Security Title Agency | |
| Trustee Deed | $97,606 | None Available | |
| Warranty Deed | -- | None Available | |
| Interfamily Deed Transfer | -- | Fidelity National Title | |
| Warranty Deed | -- | Fidelity National Title | |
| Interfamily Deed Transfer | -- | Fidelity Title | |
| Interfamily Deed Transfer | -- | Fidelity Title | |
| Interfamily Deed Transfer | -- | Fidelity National Title Agen | |
| Warranty Deed | $175,600 | Fidelity National Title Agen | |
| Interfamily Deed Transfer | -- | Fidelity National Title | |
| Interfamily Deed Transfer | -- | First American Title | |
| Interfamily Deed Transfer | -- | Transamerica Title Ins Co | |
| Warranty Deed | $51,350 | Transamerica Title Ins Co |
| Date | Status | Loan Amount | Loan Type |
|---|---|---|---|
| Open | $201,000 | New Conventional | |
| Closed | $201,000 | New Conventional | |
| Closed | $198,950 | New Conventional | |
| Closed | $195,700 | New Conventional | |
| Previous Owner | $124,684 | FHA | |
| Previous Owner | $116,820 | Seller Take Back | |
| Previous Owner | $78,000 | Unknown | |
| Previous Owner | $140,450 | Adjustable Rate Mortgage/ARM | |
| Previous Owner | $111,200 | New Conventional | |
| Previous Owner | $53,200 | No Value Available | |
| Previous Owner | $46,150 | New Conventional |
| Date | Event | Price | Change | Sq Ft Price |
|---|---|---|---|---|
| 11/28/2018 11/28/18 | Sold | $206,000 | -7.2% | $95 / Sq Ft |
| 10/18/2018 10/18/18 | Pending | -- | -- | -- |
| 10/08/2018 10/08/18 | Price Changed | $221,900 | -2.2% | $102 / Sq Ft |
| 09/17/2018 09/17/18 | Price Changed | $226,900 | -2.2% | $104 / Sq Ft |
| 09/10/2018 09/10/18 | Price Changed | $231,900 | -2.1% | $107 / Sq Ft |
| 09/04/2018 09/04/18 | Price Changed | $236,900 | -2.1% | $109 / Sq Ft |
| 08/13/2018 08/13/18 | Price Changed | $241,900 | -1.2% | $111 / Sq Ft |
| 08/02/2018 08/02/18 | Price Changed | $244,900 | -2.0% | $112 / Sq Ft |
| 07/17/2018 07/17/18 | For Sale | $249,900 | +92.5% | $115 / Sq Ft |
| 11/15/2013 11/15/13 | Sold | $129,800 | 0.0% | $60 / Sq Ft |
| 11/04/2013 11/04/13 | Pending | -- | -- | -- |
| 10/31/2013 10/31/13 | Price Changed | $129,800 | -0.1% | $60 / Sq Ft |
| 10/22/2013 10/22/13 | Price Changed | $129,900 | -1.5% | $60 / Sq Ft |
| 10/21/2013 10/21/13 | Price Changed | $131,900 | -0.5% | $61 / Sq Ft |
| 10/19/2013 10/19/13 | Price Changed | $132,600 | -0.3% | $61 / Sq Ft |
| 10/15/2013 10/15/13 | Price Changed | $133,000 | -1.5% | $61 / Sq Ft |
| 10/10/2013 10/10/13 | For Sale | $135,000 | 0.0% | $62 / Sq Ft |
| 09/18/2013 09/18/13 | Pending | -- | -- | -- |
| 09/14/2013 09/14/13 | Price Changed | $135,000 | -0.7% | $62 / Sq Ft |
| 09/10/2013 09/10/13 | Price Changed | $135,900 | -0.7% | $62 / Sq Ft |
| 09/03/2013 09/03/13 | For Sale | $136,900 | 0.0% | $63 / Sq Ft |
| 07/30/2013 07/30/13 | Pending | -- | -- | -- |
| 07/27/2013 07/27/13 | Price Changed | $136,900 | -0.1% | $63 / Sq Ft |
| 07/16/2013 07/16/13 | Price Changed | $137,000 | -0.4% | $63 / Sq Ft |
| 07/12/2013 07/12/13 | Price Changed | $137,500 | +0.4% | $63 / Sq Ft |
| 07/05/2013 07/05/13 | Price Changed | $137,000 | -0.7% | $63 / Sq Ft |
| 06/26/2013 06/26/13 | Price Changed | $138,000 | -0.7% | $63 / Sq Ft |
| 06/17/2013 06/17/13 | For Sale | $139,000 | -- | $64 / Sq Ft |
| Year | Tax Paid | Tax Assessment Tax Assessment Total Assessment is a certain percentage of the fair market value that is determined by local assessors to be the total taxable value of land and additions on the property. | Land | Improvement |
|---|---|---|---|---|
| 2025 | $1,507 | $35,543 | -- | -- |
| 2024 | $1,422 | $37,373 | -- | -- |
| 2023 | $1,483 | $31,364 | $2,318 | $29,046 |
| 2022 | $1,422 | $21,815 | $2,318 | $19,497 |
| 2021 | $1,449 | $20,116 | $0 | $0 |
| 2020 | $1,411 | $18,714 | $0 | $0 |
| 2019 | $1,354 | $18,107 | $0 | $0 |
| 2018 | $1,173 | $15,409 | $0 | $0 |
| 2017 | $1,144 | $13,137 | $0 | $0 |
| 2016 | $1,109 | $12,782 | $1,100 | $11,682 |
| 2014 | $1,065 | $6,977 | $1,100 | $5,877 |
Seller's Agent in 2018
Debra Mclean
My Home Group Real Estate
(480) 205-5979
2 in this area
93 Total Sales
Buyer's Agent in 2018
Mark Gunning
West USA Realty
(626) 590-3177
3 in this area
82 Total Sales
Seller's Agent in 2013
Neal Yukolis
My Home Group Real Estate
(480) 215-0292
2 Total Sales
Source: Arizona Regional Multiple Listing Service (ARMLS)
MLS Number: 4953877
APN: 102-27-144
Disclaimer: Certain information contained herein is derived from information provided by parties other than Homes.com. All information provided is deemed reliable, but is not guaranteed to be accurate and should be independently verified.
![]() All information should be verified by the recipient and none is guaranteed as accurate by ARMLS
All information should be verified by the recipient and none is guaranteed as accurate by ARMLS
Listing Information presented by local MLS brokerage: Ten-X, local REALTOR®- Arlene Richardson - (888)-952-6393