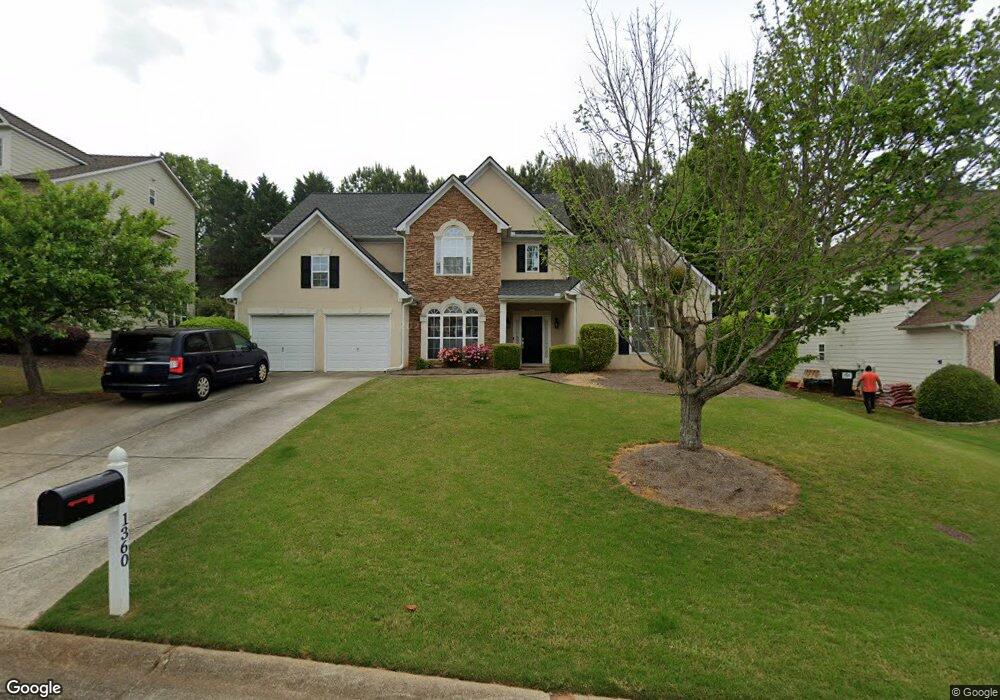
1360 Mystic Ridge Place Cumming, GA 30040
Estimated Value: $599,000 - $741,000
5
Beds
4
Baths
4,119
Sq Ft
$159/Sq Ft
Est. Value
About This Home
This home is located at 1360 Mystic Ridge Place, Cumming, GA 30040 and is currently estimated at $654,928, approximately $159 per square foot. 1360 Mystic Ridge Place is a home located in Forsyth County with nearby schools including Kelly Mill Elementary School, Hendricks Middle School, and Forsyth Central High School.
Ownership History
Date
Name
Owned For
Owner Type
Purchase Details
Closed on
Mar 26, 2010
Sold by
Corley Paul
Bought by
Corley Paul and Corley Toni L
Current Estimated Value
Home Financials for this Owner
Home Financials are based on the most recent Mortgage that was taken out on this home.
Original Mortgage
$205,214
Interest Rate
5.12%
Mortgage Type
FHA
Purchase Details
Closed on
Sep 1, 2009
Sold by
Citimortgage Inc
Bought by
Federal Natl Mtg Assn Fnma
Purchase Details
Closed on
Jul 18, 2005
Sold by
Mccar Homes Inc Ga
Bought by
Richardson Brandi
Home Financials for this Owner
Home Financials are based on the most recent Mortgage that was taken out on this home.
Original Mortgage
$206,000
Interest Rate
5.38%
Mortgage Type
New Conventional
Create a Home Valuation Report for This Property
The Home Valuation Report is an in-depth analysis detailing your home's value as well as a comparison with similar homes in the area
Home Values in the Area
Average Home Value in this Area
Purchase History
| Date | Buyer | Sale Price | Title Company |
|---|---|---|---|
| Corley Paul | -- | -- | |
| Corley Paul | -- | -- | |
| Federal Natl Mtg Assn Fnma | -- | -- | |
| Citimortgage Inc | $221,757 | -- | |
| Richardson Brandi | $286,900 | -- |
Source: Public Records
Mortgage History
| Date | Status | Borrower | Loan Amount |
|---|---|---|---|
| Previous Owner | Corley Paul | $205,214 | |
| Previous Owner | Richardson Brandi | $206,000 |
Source: Public Records
Tax History Compared to Growth
Tax History
| Year | Tax Paid | Tax Assessment Tax Assessment Total Assessment is a certain percentage of the fair market value that is determined by local assessors to be the total taxable value of land and additions on the property. | Land | Improvement |
|---|---|---|---|---|
| 2025 | $5,067 | $245,184 | $74,000 | $171,184 |
| 2024 | $5,067 | $243,104 | $68,000 | $175,104 |
| 2023 | $4,285 | $218,020 | $60,000 | $158,020 |
| 2022 | $4,294 | $147,136 | $40,000 | $107,136 |
| 2021 | $3,872 | $147,136 | $40,000 | $107,136 |
| 2020 | $3,751 | $141,272 | $40,000 | $101,272 |
| 2019 | $3,550 | $131,648 | $26,000 | $105,648 |
| 2018 | $3,844 | $145,144 | $26,000 | $119,144 |
| 2017 | $3,597 | $132,744 | $28,000 | $104,744 |
| 2016 | $3,704 | $133,464 | $20,000 | $113,464 |
| 2015 | $3,453 | $124,184 | $20,000 | $104,184 |
| 2014 | $2,971 | $112,204 | $0 | $0 |
Source: Public Records
Map
Nearby Homes
- 1930 Stardust Trail
- 3995 Village Estates Ct
- 825 Mill Garden Place
- 4010 Village Estates Ct
- 4540 Natchez Ln
- 3830 Village Estates Ct Unit 3
- 517 Kelly Mill Rd
- 516 Kelly Mill Rd Unit LAND
- 516 Kelly Mill Rd Unit HOME
- 516 Kelly Mill Rd
- 3428 Castleberry Village Cir Unit 47
- 113 Hickory Trail
- 1620 Greystone Rd
- 2045 Crossover Dr
- 1905 Barrett Dr
- 5540 Castlebrooke Glen Ct
- 4835 White Blossom Ct
- 1775 Lantana Trail
- 5540 Keithwood Ct
- 1350 Mystic Ridge Place
- 1370 Mystic Ridge Place
- 1370 Mystic Ridge Place
- 1245 Hidden Creek Point
- 1340 Mystic Ridge Place
- 1265 Hidden Creek Point
- 1380 Mystic Ridge Place
- 1375 Mystic Ridge Place
- 1365 Mystic Ridge Place
- 0 Chamblee Gap Rd Unit 6 7375332
- 0 Chamblee Gap Rd Unit 3 7375322
- 0 Chamblee Gap Rd Unit 2 7375319
- 0 Chamblee Gap Rd Unit 5 7375326
- 0 Chamblee Gap Rd Unit 1 7375307
- 0 Chamblee Gap Rd
- 0 Chamblee Gap Rd Unit 7456976
- 0 Chamblee Gap Rd Unit 8709375
- 0 Chamblee Gap Rd Unit 6864890
- 0 Chamblee Gap Rd Unit 8955577
- 0 Chamblee Gap Rd Unit 8344666