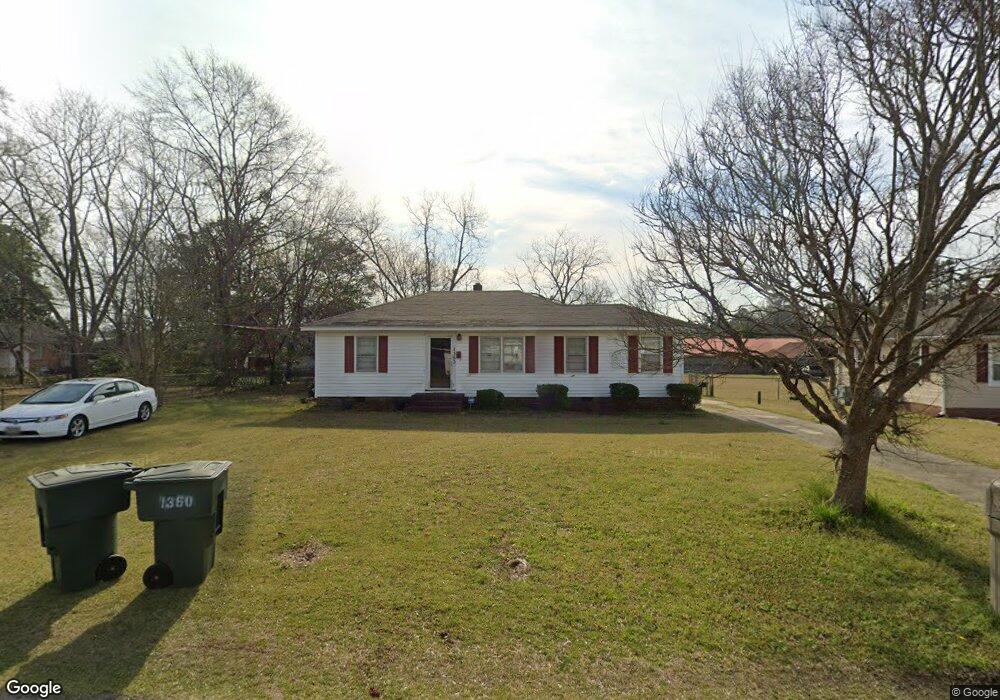
1360 Schley St Orangeburg, SC 29115
Estimated Value: $120,000 - $126,000
3
Beds
2
Baths
1,189
Sq Ft
$103/Sq Ft
Est. Value
About This Home
This home is located at 1360 Schley St, Orangeburg, SC 29115 and is currently estimated at $122,364, approximately $102 per square foot. 1360 Schley St is a home located in Orangeburg County with nearby schools including Brookdale Elementary School, Brookdale Elementary, and Robert E. Howard Middle School.
Ownership History
Date
Name
Owned For
Owner Type
Purchase Details
Closed on
Jun 8, 2011
Sold by
Federal National Mortgage Association
Bought by
Sabb Willard S
Current Estimated Value
Home Financials for this Owner
Home Financials are based on the most recent Mortgage that was taken out on this home.
Original Mortgage
$59,144
Outstanding Balance
$40,658
Interest Rate
4.57%
Mortgage Type
VA
Estimated Equity
$81,706
Purchase Details
Closed on
Apr 26, 2011
Sold by
Creese Atiba
Bought by
Federal National Mortgage Association
Home Financials for this Owner
Home Financials are based on the most recent Mortgage that was taken out on this home.
Original Mortgage
$59,144
Outstanding Balance
$40,658
Interest Rate
4.57%
Mortgage Type
VA
Estimated Equity
$81,706
Purchase Details
Closed on
Jul 29, 2005
Sold by
Wachowski Michael C and Wachowski Amy S
Bought by
Creese Atiba and Creese Demestress
Home Financials for this Owner
Home Financials are based on the most recent Mortgage that was taken out on this home.
Original Mortgage
$15,340
Interest Rate
5.48%
Mortgage Type
Stand Alone Second
Create a Home Valuation Report for This Property
The Home Valuation Report is an in-depth analysis detailing your home's value as well as a comparison with similar homes in the area
Home Values in the Area
Average Home Value in this Area
Purchase History
| Date | Buyer | Sale Price | Title Company |
|---|---|---|---|
| Sabb Willard S | $57,900 | -- | |
| Federal National Mortgage Association | $30,000 | -- | |
| Creese Atiba | $76,700 | -- |
Source: Public Records
Mortgage History
| Date | Status | Borrower | Loan Amount |
|---|---|---|---|
| Open | Sabb Willard S | $59,144 | |
| Previous Owner | Creese Atiba | $15,340 |
Source: Public Records
Tax History Compared to Growth
Tax History
| Year | Tax Paid | Tax Assessment Tax Assessment Total Assessment is a certain percentage of the fair market value that is determined by local assessors to be the total taxable value of land and additions on the property. | Land | Improvement |
|---|---|---|---|---|
| 2024 | $2,313 | $3,583 | $599 | $2,984 |
| 2023 | $2,043 | $2,667 | $559 | $2,108 |
| 2022 | $1,963 | $2,667 | $559 | $2,108 |
| 2021 | $1,955 | $2,667 | $559 | $2,108 |
| 2020 | $710 | $2,667 | $559 | $2,108 |
| 2019 | $712 | $2,667 | $559 | $2,108 |
| 2018 | $685 | $2,687 | $559 | $2,128 |
| 2017 | $658 | $2,687 | $0 | $0 |
| 2016 | $658 | $2,687 | $0 | $0 |
| 2015 | $384 | $2,687 | $0 | $0 |
| 2014 | $384 | $2,687 | $559 | $2,128 |
| 2013 | -- | $2,719 | $559 | $2,160 |
Source: Public Records
Map
Nearby Homes
- 1069 Chestnut St
- 1135 Gloria St
- 1231 Eutaw St
- 1238 Dantzler St
- 1174 Ellis Ave
- 1188 Gloria St
- 1235 Sawyer St
- 1254 Sawyer St
- 1103 Ellis Ave
- 1280 Saint Matthews Rd
- 1085 Ellis Ave
- 1236 College Ave
- 782 Spring St
- 1090 College Ave
- 898 Ellis Ave
- 1118 Decatur St NE
- 0 Decatur St NE
- 1697 Enderly St
- 1392 Morris St
- 1840 Carolina Ave
- 1346 Schley St
- 1085 Chestnut St
- 1045 Chestnut St
- 1328 Schley St
- 1370 Schley St
- 1341 Schley St
- 1105 Chestnut St
- 1335 Schley St
- 1111 Chestnut St
- 1111 Chestnut St
- 1294 Schley St
- 1287 Fairfield St
- 1313 Schley St
- 1004 Chestnut St
- 1117 Chestnut St
- 1282 Schley St
- 1120 Gloria St
- 1293 Schley St
- 1263 Fairfield St
- 1266 Schley St