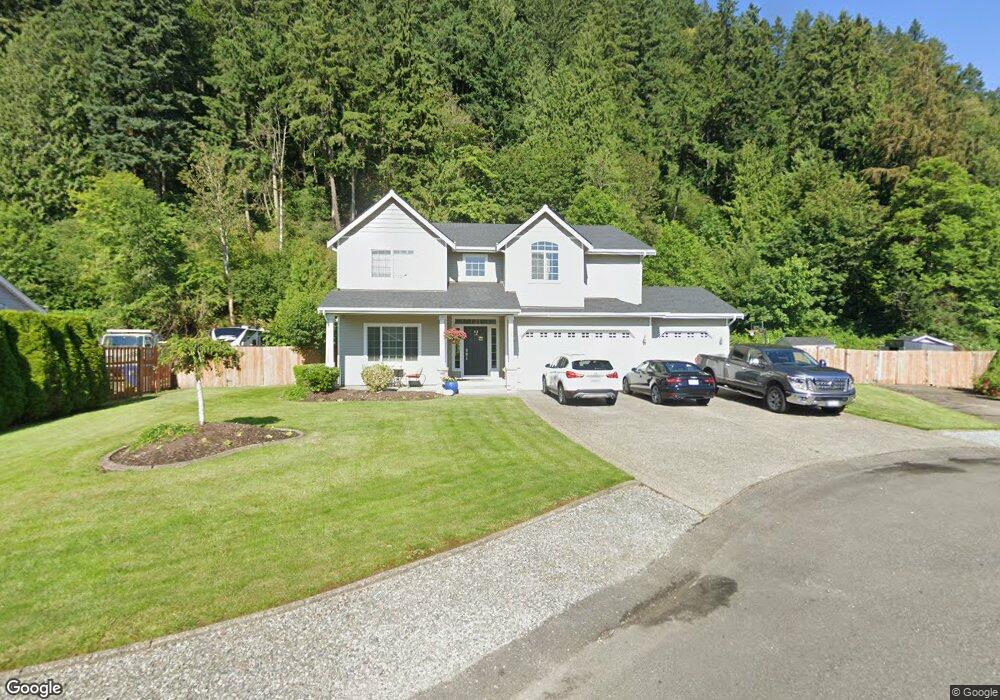
13602 139th Ave E Orting, WA 98360
Estimated Value: $725,076 - $796,000
4
Beds
3
Baths
2,758
Sq Ft
$274/Sq Ft
Est. Value
About This Home
This home is located at 13602 139th Ave E, Orting, WA 98360 and is currently estimated at $754,519, approximately $273 per square foot. 13602 139th Ave E is a home located in Pierce County with nearby schools including Maple Lawn Elementary School, Sumner Middle School, and Sumner High School.
Ownership History
Date
Name
Owned For
Owner Type
Purchase Details
Closed on
Sep 7, 2004
Sold by
Abram William A
Bought by
Lysene Kendall P and Lysene Sarah R
Current Estimated Value
Home Financials for this Owner
Home Financials are based on the most recent Mortgage that was taken out on this home.
Original Mortgage
$274,500
Outstanding Balance
$131,783
Interest Rate
6.06%
Mortgage Type
Purchase Money Mortgage
Estimated Equity
$622,736
Purchase Details
Closed on
Feb 25, 2004
Sold by
South Fork Estates Llc
Bought by
Abram William A and Abram Marjorie A
Home Financials for this Owner
Home Financials are based on the most recent Mortgage that was taken out on this home.
Original Mortgage
$238,644
Interest Rate
5.62%
Mortgage Type
Construction
Create a Home Valuation Report for This Property
The Home Valuation Report is an in-depth analysis detailing your home's value as well as a comparison with similar homes in the area
Home Values in the Area
Average Home Value in this Area
Purchase History
| Date | Buyer | Sale Price | Title Company |
|---|---|---|---|
| Lysene Kendall P | $305,000 | First American Title Ins Co | |
| Abram William A | $72,000 | Chicago Title Insurance Co |
Source: Public Records
Mortgage History
| Date | Status | Borrower | Loan Amount |
|---|---|---|---|
| Open | Lysene Kendall P | $274,500 | |
| Previous Owner | Abram William A | $238,644 |
Source: Public Records
Tax History
| Year | Tax Paid | Tax Assessment Tax Assessment Total Assessment is a certain percentage of the fair market value that is determined by local assessors to be the total taxable value of land and additions on the property. | Land | Improvement |
|---|---|---|---|---|
| 2025 | $7,372 | $724,900 | $290,900 | $434,000 |
| 2024 | $7,372 | $672,900 | $262,800 | $410,100 |
| 2023 | $7,372 | $643,500 | $237,000 | $406,500 |
| 2022 | $7,331 | $664,700 | $253,400 | $411,300 |
| 2021 | $6,863 | $486,100 | $167,000 | $319,100 |
| 2019 | $5,928 | $461,500 | $148,800 | $312,700 |
| 2018 | $5,933 | $440,600 | $143,000 | $297,600 |
| 2017 | $5,579 | $394,400 | $113,300 | $281,100 |
| 2016 | $4,927 | $342,100 | $91,900 | $250,200 |
| 2014 | $4,416 | $310,700 | $79,300 | $231,400 |
| 2013 | $4,416 | $277,400 | $69,600 | $207,800 |
Source: Public Records
Map
Nearby Homes
- 14009 134th Ave E
- 14526 136th Street Ct E Unit 5-A
- 13114 Sunridge Way E
- 13502 144th St E
- 12425 137th Ave E
- 12430 136th Ave E
- 13906 126th Ave E
- 12915 147th St E
- 13611 124th Avenue Ct E
- 13515 152nd St E
- 13416 124th Ave E
- 15104 148th St E
- 12503 151st Ave E
- 12617 125th Avenue Ct E
- 14926 122nd St E Unit 21
- 13314 120th St E
- 15007 148th Avenue Ct E
- 12711 151st St E
- 12521 Military Rd E
- 12602 Military Rd E
- 10628 136th St Ct E
- 13608 139th Ave E
- 13905 136th Street Ct E
- 13908 136th Street Ct E
- 13616 139th Ave E
- 13909 136th Street Ct E
- 13615 139th Ave E
- 13912 136th Street Ct E
- 13704 139th Ave E
- 13620 140th Ave E
- 19916 137th Ave E Unit 37
- 13913 136th Street Ct E
- 13703 139th Ave E
- 14002 136th Street Ct E
- 13706 140th Ave E
- 13716 139th Ave E
- 13621 140th Ave E
- 19905 SE 137th Ave E
- 19905 SE 137th Ave E Unit 6
- 14003 136th Street Ct E
Your Personal Tour Guide
Ask me questions while you tour the home.