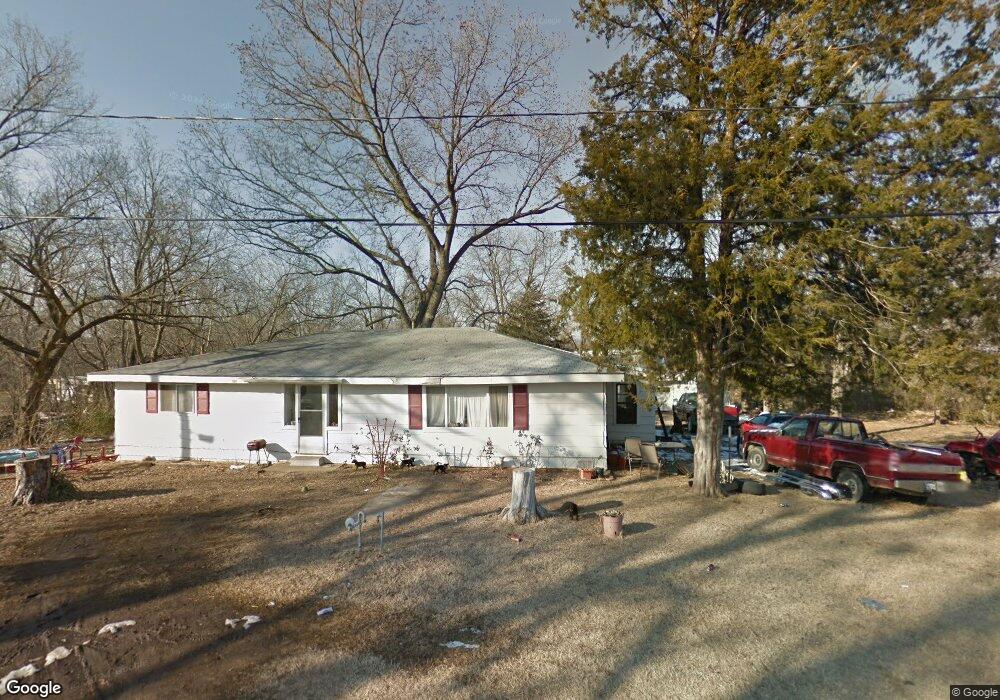
13605 Bulrush St Henryetta, OK 74437
Estimated Value: $92,398 - $163,000
3
Beds
1
Bath
1,308
Sq Ft
$95/Sq Ft
Est. Value
About This Home
This home is located at 13605 Bulrush St, Henryetta, OK 74437 and is currently estimated at $124,100, approximately $94 per square foot. 13605 Bulrush St is a home located in Okmulgee County with nearby schools including Schulter Elementary School and Schulter High School.
Ownership History
Date
Name
Owned For
Owner Type
Purchase Details
Closed on
Jul 28, 2009
Sold by
Blue Spruce Entities Llc and Kahl Frank
Bought by
Devine Elvis B and Devine Mary B
Current Estimated Value
Home Financials for this Owner
Home Financials are based on the most recent Mortgage that was taken out on this home.
Original Mortgage
$18,000
Interest Rate
5.31%
Mortgage Type
Unknown
Purchase Details
Closed on
Jul 15, 2009
Sold by
Nationstar Mortgage Llc
Bought by
Blue Spruce Entities Llc
Home Financials for this Owner
Home Financials are based on the most recent Mortgage that was taken out on this home.
Original Mortgage
$18,000
Interest Rate
5.31%
Mortgage Type
Unknown
Purchase Details
Closed on
Aug 6, 2008
Sold by
Webb Michael
Bought by
Nationstar Mortgage Llc
Purchase Details
Closed on
Jan 31, 2003
Sold by
Bezinque Henry and Bezinque Wife
Bought by
Webb Michael D
Create a Home Valuation Report for This Property
The Home Valuation Report is an in-depth analysis detailing your home's value as well as a comparison with similar homes in the area
Purchase History
| Date | Buyer | Sale Price | Title Company |
|---|---|---|---|
| Devine Elvis B | $20,000 | None Available | |
| Blue Spruce Entities Llc | $3,500 | None Available | |
| Nationstar Mortgage Llc | -- | None Available | |
| Webb Michael D | $37,500 | -- |
Source: Public Records
Mortgage History
| Date | Status | Borrower | Loan Amount |
|---|---|---|---|
| Previous Owner | Devine Elvis B | $18,000 |
Source: Public Records
Tax History
| Year | Tax Paid | Tax Assessment Tax Assessment Total Assessment is a certain percentage of the fair market value that is determined by local assessors to be the total taxable value of land and additions on the property. | Land | Improvement |
|---|---|---|---|---|
| 2025 | $281 | $3,865 | $154 | $3,711 |
| 2024 | $257 | $3,681 | $154 | $3,527 |
| 2023 | $256 | $3,681 | $154 | $3,527 |
| 2022 | $296 | $4,245 | $154 | $4,091 |
| 2021 | $296 | $4,245 | $154 | $4,091 |
| 2020 | $296 | $4,245 | $154 | $4,091 |
| 2019 | $305 | $4,245 | $154 | $4,091 |
| 2018 | $339 | $4,297 | $154 | $4,143 |
| 2017 | $354 | $4,463 | $154 | $4,309 |
| 2016 | $363 | $4,251 | $154 | $4,097 |
| 2015 | $462 | $4,840 | $154 | $4,686 |
| 2014 | $454 | $4,712 | $150 | $4,562 |
Source: Public Records
Map
Nearby Homes
- 24215 B St
- 0 Aster St
- 14626 Lavender
- 13975 Cedar Ave
- E E 1060 Rd
- TBD Conifer Rd
- 815 E Tutt St
- 1302 W 7th St
- 13067 Bristlecone Rd
- 0 Leonard Ln Unit 2541688
- 1108 E 6th St
- 2009 Hillcrest Dr
- 0000 Hackberry Rd
- 509 E Elder
- 24460 S 200 Rd
- 24751 S 200 Rd
- 0 Conifer Rd Unit 25574261
- 24833 S 200 Rd
- Lot A N 3938 Rd
- LOT F N 3938 Rd
- 13604 Bulrush St
- 13570 Bulrush St
- 24130 C St
- 13545 Bulrush St
- 13642 Bulrush St
- 13552 Bulrush St
- 13595 Buckbrush St
- 13625 Buttercup St
- 13527 Buckbrush St
- 723 Rr 3
- 13665 Buttercup St
- 13618 Buttercup St
- 13554 Bramble St Unit SR
- 13774 Bulrush St
- 24015 C St
- 24273 B St
- 13705 Buttercup St
- 13690 Bramble St
- 242740 C St
- 13503 Cactus
Your Personal Tour Guide
Ask me questions while you tour the home.