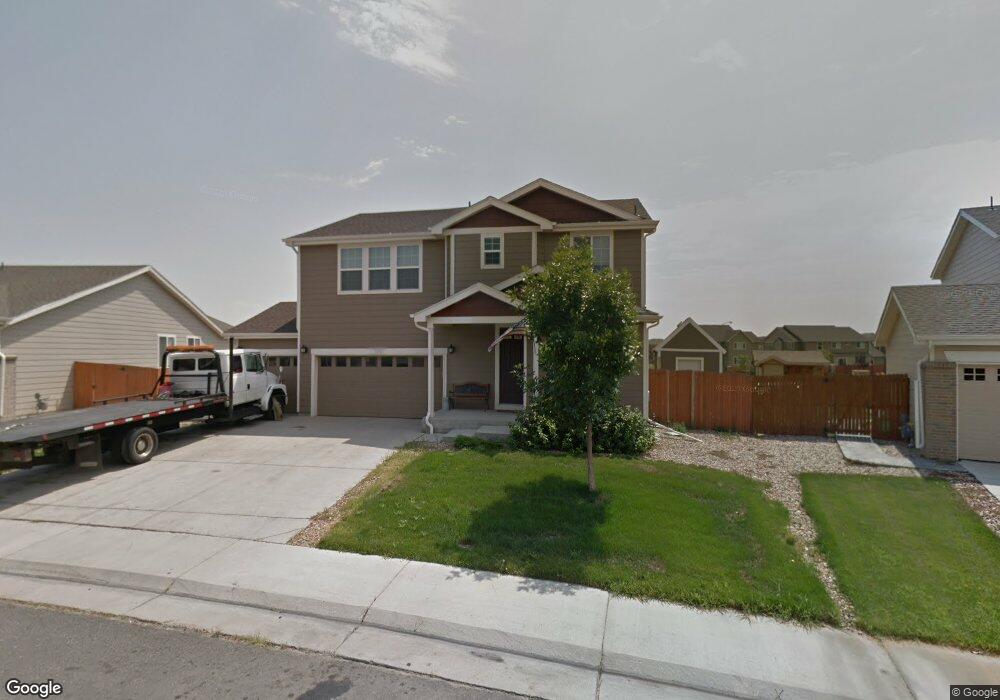
13607 Krameria St Thornton, CO 80602
Springvale NeighborhoodEstimated Value: $646,805 - $693,000
4
Beds
4
Baths
2,828
Sq Ft
$237/Sq Ft
Est. Value
About This Home
This home is located at 13607 Krameria St, Thornton, CO 80602 and is currently estimated at $669,951, approximately $236 per square foot. 13607 Krameria St is a home located in Adams County with nearby schools including West Ridge Elementary School, Shore Acres Elementary School, and Elderberry Elementary.
Ownership History
Date
Name
Owned For
Owner Type
Purchase Details
Closed on
Jun 21, 2022
Sold by
Tsen-Txheng Lo
Bought by
Nguyen Rick and Mai Henry
Current Estimated Value
Home Financials for this Owner
Home Financials are based on the most recent Mortgage that was taken out on this home.
Original Mortgage
$637,972
Outstanding Balance
$607,191
Interest Rate
5.3%
Mortgage Type
FHA
Estimated Equity
$62,760
Purchase Details
Closed on
Sep 17, 2015
Sold by
Sawyer Carissa L and Sawyer Teague E
Bought by
Lo Tsen Txheng
Home Financials for this Owner
Home Financials are based on the most recent Mortgage that was taken out on this home.
Original Mortgage
$343,151
Interest Rate
3.95%
Mortgage Type
FHA
Purchase Details
Closed on
Jul 20, 2006
Sold by
Kb Home Colorado Inc
Bought by
Sawyer Carissa L and Sawyer Teague E
Home Financials for this Owner
Home Financials are based on the most recent Mortgage that was taken out on this home.
Original Mortgage
$236,000
Interest Rate
6.78%
Mortgage Type
New Conventional
Create a Home Valuation Report for This Property
The Home Valuation Report is an in-depth analysis detailing your home's value as well as a comparison with similar homes in the area
Home Values in the Area
Average Home Value in this Area
Purchase History
| Date | Buyer | Sale Price | Title Company |
|---|---|---|---|
| Nguyen Rick | $660,000 | First American Title | |
| Lo Tsen Txheng | $355,000 | Stewart Title | |
| Sawyer Carissa L | $295,000 | Security Title |
Source: Public Records
Mortgage History
| Date | Status | Borrower | Loan Amount |
|---|---|---|---|
| Open | Nguyen Rick | $637,972 | |
| Previous Owner | Lo Tsen Txheng | $343,151 | |
| Previous Owner | Sawyer Carissa L | $236,000 |
Source: Public Records
Tax History Compared to Growth
Tax History
| Year | Tax Paid | Tax Assessment Tax Assessment Total Assessment is a certain percentage of the fair market value that is determined by local assessors to be the total taxable value of land and additions on the property. | Land | Improvement |
|---|---|---|---|---|
| 2024 | $4,348 | $40,070 | $6,880 | $33,190 |
| 2023 | $4,327 | $48,300 | $6,900 | $41,400 |
| 2022 | $3,180 | $32,420 | $7,090 | $25,330 |
| 2021 | $3,063 | $32,420 | $7,090 | $25,330 |
| 2020 | $3,030 | $33,470 | $7,290 | $26,180 |
| 2019 | $3,033 | $33,470 | $7,290 | $26,180 |
| 2018 | $2,657 | $29,310 | $6,840 | $22,470 |
| 2017 | $2,653 | $29,310 | $6,840 | $22,470 |
| 2016 | $2,193 | $24,140 | $4,140 | $20,000 |
| 2015 | $2,188 | $24,140 | $4,140 | $20,000 |
| 2014 | $1,784 | $19,990 | $3,500 | $16,490 |
Source: Public Records
Map
Nearby Homes
- 6345 E 135th Ave
- 13696 Lilac St
- 6078 E 137th Ave
- 13798 Krameria St
- 13391 Locust Ct
- 13385 Jasmine St
- 13349 Krameria St
- 13830 Ivy St
- 6375 E 139th Ave
- 13877 Hudson Way
- 13234 Krameria St
- 13937 Hudson Way
- 6893 E 132nd Place
- 5964 E 141st Ave
- 13275 Holly St Unit F
- 14094 Ivy Ct
- 5323 E 140th Place
- 13271 Holly St Unit B
- 6319 E 141st Dr
- 13243 Holly St Unit F
- 13601 Krameria St
- 13617 Krameria St
- 13608 Krameria St
- 13604 Krameria St
- 13621 Krameria St
- 13618 Krameria St
- 6302 E 136th Place
- 13617 Leyden Ct
- 13627 Krameria St
- 13602 Leyden Ct
- 13632 Krameria St
- 6271 E 135th Ave
- 6285 E 135th Ave
- 6310 E 136th Place
- 13612 Leyden Ct
- 13629 Leyden Ct
- 13637 Krameria St
- 6243 E 135th Ave
- 13638 Krameria St
- 13622 Leyden Ct