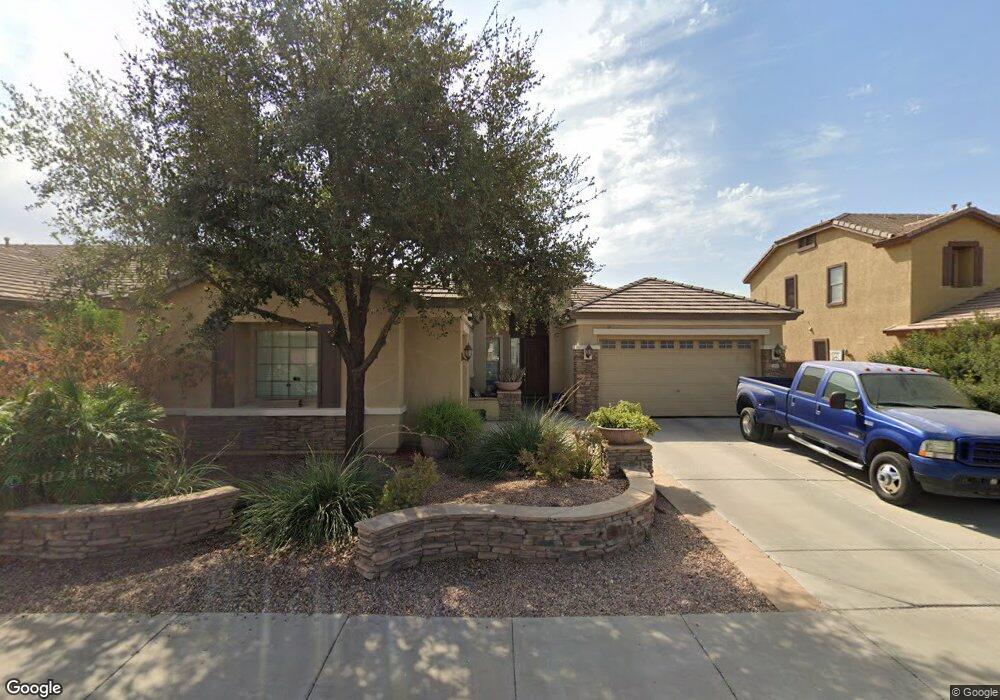
13607 W Merrell St Avondale, AZ 85392
Rancho Santa Fe NeighborhoodEstimated Value: $482,293 - $624,000
4
Beds
2
Baths
2,515
Sq Ft
$214/Sq Ft
Est. Value
About This Home
This home is located at 13607 W Merrell St, Avondale, AZ 85392 and is currently estimated at $537,323, approximately $213 per square foot. 13607 W Merrell St is a home located in Maricopa County with nearby schools including Litchfield Elementary School, Western Sky Middle School, and Archway Classical Academy | Trivium.
Ownership History
Date
Name
Owned For
Owner Type
Purchase Details
Closed on
Nov 19, 2009
Sold by
Fannie Mae
Bought by
Henry Jennifer and Henry Marc A
Current Estimated Value
Home Financials for this Owner
Home Financials are based on the most recent Mortgage that was taken out on this home.
Original Mortgage
$227,500
Outstanding Balance
$147,252
Interest Rate
4.83%
Mortgage Type
VA
Estimated Equity
$390,071
Purchase Details
Closed on
Sep 17, 2009
Sold by
Philips Russell W
Bought by
Federal National Mortgage Association
Purchase Details
Closed on
Feb 2, 2006
Sold by
Fulton Homes Sales Corp
Bought by
Philips Russell W
Home Financials for this Owner
Home Financials are based on the most recent Mortgage that was taken out on this home.
Original Mortgage
$338,985
Interest Rate
6.62%
Mortgage Type
Purchase Money Mortgage
Create a Home Valuation Report for This Property
The Home Valuation Report is an in-depth analysis detailing your home's value as well as a comparison with similar homes in the area
Home Values in the Area
Average Home Value in this Area
Purchase History
| Date | Buyer | Sale Price | Title Company |
|---|---|---|---|
| Henry Jennifer | $227,500 | Old Republic Title Agency | |
| Federal National Mortgage Association | $355,427 | Servicelink | |
| Philips Russell W | $397,081 | The Talon Group Tempe Supers | |
| Fulton Homes Sales Corp | $270,814 | The Talon Group Tempe Supers |
Source: Public Records
Mortgage History
| Date | Status | Borrower | Loan Amount |
|---|---|---|---|
| Open | Henry Jennifer | $227,500 | |
| Previous Owner | Philips Russell W | $338,985 |
Source: Public Records
Tax History Compared to Growth
Tax History
| Year | Tax Paid | Tax Assessment Tax Assessment Total Assessment is a certain percentage of the fair market value that is determined by local assessors to be the total taxable value of land and additions on the property. | Land | Improvement |
|---|---|---|---|---|
| 2025 | $2,599 | $29,763 | -- | -- |
| 2024 | $2,504 | $28,346 | -- | -- |
| 2023 | $2,504 | $38,170 | $7,630 | $30,540 |
| 2022 | $2,432 | $29,980 | $5,990 | $23,990 |
| 2021 | $2,542 | $28,200 | $5,640 | $22,560 |
| 2020 | $2,460 | $26,680 | $5,330 | $21,350 |
| 2019 | $2,428 | $24,920 | $4,980 | $19,940 |
| 2018 | $2,393 | $23,780 | $4,750 | $19,030 |
| 2017 | $2,221 | $22,800 | $4,560 | $18,240 |
| 2016 | $2,154 | $21,170 | $4,230 | $16,940 |
| 2015 | $2,023 | $20,570 | $4,110 | $16,460 |
Source: Public Records
Map
Nearby Homes
- 13611 W Merrell St
- 13506 W Earll Dr
- 2801 N Litchfield Rd Unit 27
- 2801 N Litchfield Rd Unit 54
- 2801 N Litchfield Rd Unit 44
- 2801 N Litchfield Rd Unit 65
- 2741 N 137th Ave
- 13779 W Earll Dr
- 3220 N 136th Dr
- 13350 W La Reata Ave
- 13743 W Windsor Ave
- 13722 W Vernon Ave Unit 1
- 13820 W Cheery Lynn Rd
- 13511 Fairway Loop S Unit 35G2
- 13888 W Wilshire Dr
- 324 E Laguna Royale
- 13259 W Flower St
- 13160 W Windsor Ave
- 13587 W Cypress St
- 13613 W Cypress St
- 13603 W Merrell St
- 13606 W Verde Ln
- 13610 W Verde Ln
- 13602 W Verde Ln
- 13606 W Merrell St
- 13610 W Merrell St
- 13614 W Verde Ln
- 13602 W Merrell St
- 13614 W Merrell St
- 13619 W Merrell St
- 13523 W Merrell St
- 13618 W Merrell St
- 13618 W Verde Ln
- 13522 W Verde Ln
- 13526 W Merrell St
- 13622 W Merrell St
- 13519 W Merrell St
- 13607 W Catalina Dr
- 13611 W Catalina Dr
- 13605 W Verde Ln