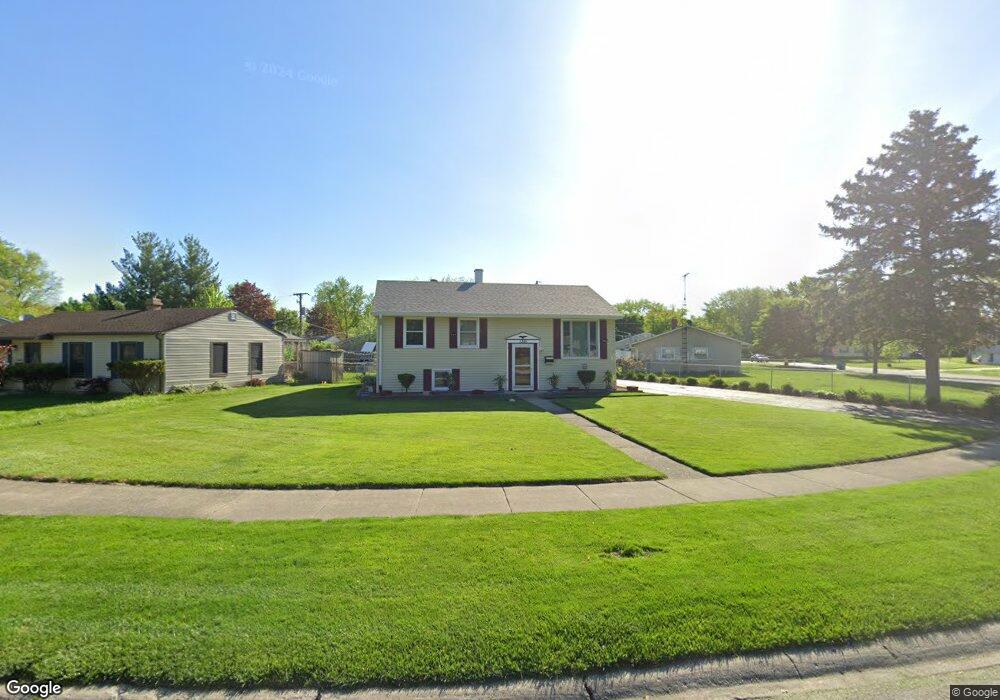
1361 Crestwood Dr Aurora, IL 60506
North River NeighborhoodEstimated Value: $255,000 - $316,000
4
Beds
3
Baths
1,886
Sq Ft
$155/Sq Ft
Est. Value
About This Home
This home is located at 1361 Crestwood Dr, Aurora, IL 60506 and is currently estimated at $292,765, approximately $155 per square foot. 1361 Crestwood Dr is a home located in Kane County with nearby schools including Smith Elementary School, Jewel Middle School, and West Aurora High School.
Ownership History
Date
Name
Owned For
Owner Type
Purchase Details
Closed on
Jul 19, 2006
Sold by
Paustian Jackie
Bought by
Perse Dorin and Perse Adriana M
Current Estimated Value
Home Financials for this Owner
Home Financials are based on the most recent Mortgage that was taken out on this home.
Original Mortgage
$121,520
Outstanding Balance
$72,818
Interest Rate
6.82%
Mortgage Type
Purchase Money Mortgage
Estimated Equity
$219,947
Purchase Details
Closed on
May 15, 2003
Sold by
Paustan Patricia Brock
Bought by
Paustan Jackie
Home Financials for this Owner
Home Financials are based on the most recent Mortgage that was taken out on this home.
Original Mortgage
$125,000
Interest Rate
5.78%
Mortgage Type
Purchase Money Mortgage
Purchase Details
Closed on
May 6, 1997
Sold by
Brock Lloyd A
Bought by
Paustian Patricia Brock
Create a Home Valuation Report for This Property
The Home Valuation Report is an in-depth analysis detailing your home's value as well as a comparison with similar homes in the area
Home Values in the Area
Average Home Value in this Area
Purchase History
| Date | Buyer | Sale Price | Title Company |
|---|---|---|---|
| Perse Dorin | $152,000 | Ticor Title Ins Co 2002 | |
| Paustan Jackie | -- | Cst Title | |
| Paustian Patricia Brock | -- | -- |
Source: Public Records
Mortgage History
| Date | Status | Borrower | Loan Amount |
|---|---|---|---|
| Open | Perse Dorin | $121,520 | |
| Previous Owner | Paustan Jackie | $125,000 |
Source: Public Records
Tax History
| Year | Tax Paid | Tax Assessment Tax Assessment Total Assessment is a certain percentage of the fair market value that is determined by local assessors to be the total taxable value of land and additions on the property. | Land | Improvement |
|---|---|---|---|---|
| 2024 | $5,655 | $79,418 | $13,260 | $66,158 |
| 2023 | $5,393 | $70,960 | $11,848 | $59,112 |
| 2022 | $5,200 | $64,744 | $10,810 | $53,934 |
| 2021 | $4,959 | $60,277 | $10,064 | $50,213 |
| 2020 | $5,524 | $65,005 | $9,348 | $55,657 |
| 2019 | $5,303 | $60,229 | $8,661 | $51,568 |
| 2018 | $4,795 | $54,028 | $8,011 | $46,017 |
| 2017 | $4,469 | $49,425 | $7,381 | $42,044 |
| 2016 | $4,094 | $44,540 | $6,327 | $38,213 |
| 2015 | -- | $38,889 | $5,441 | $33,448 |
| 2014 | -- | $36,293 | $5,233 | $31,060 |
| 2013 | -- | $37,963 | $5,158 | $32,805 |
Source: Public Records
Map
Nearby Homes
- 461 Sullivan Rd
- 1229 Yellowpine Dr
- 847 Foran Ln
- 388 Manor Place
- 833 Sheldon Ave
- 500 California Ave
- 781 N Elmwood Dr
- 1104 New Haven Ave
- 1351 Monomoy St Unit D
- 1389 Monomoy St Unit B2
- 833 N Randall Rd Unit C4
- 811 N Randall Rd Unit B
- 1358 Monomoy St Unit A
- 1421 Heather Dr
- 418 W Illinois Ave
- 1815 Brighton Cir
- 603 N May St
- 742 N Glenwood Place
- 1039 S Pleasure Ct
- 1845 Walden Cir
- 1369 Crestwood Dr
- 765 Crestwood Dr
- 1373 Crestwood Dr
- 1364 Robinwood Dr Unit 3
- 757 Crestwood Dr Unit 2
- 1370 Robinwood Dr Unit 3
- 1370 Robinwood Dr
- 1405 Crestwood Dr Unit 3
- 766 Crestwood Dr
- 1362 Crestwood Dr
- 804 Holiday Dr
- 774 Crestwood Dr
- 1400 Robinwood Dr
- 1356 Crestwood Dr
- 1409 Crestwood Dr Unit 3
- 756 Crestwood Dr
- 1406 Robinwood Dr
- 1352 Crestwood Dr
- 805 Holiday Dr
- 1413 Crestwood Dr Unit 3