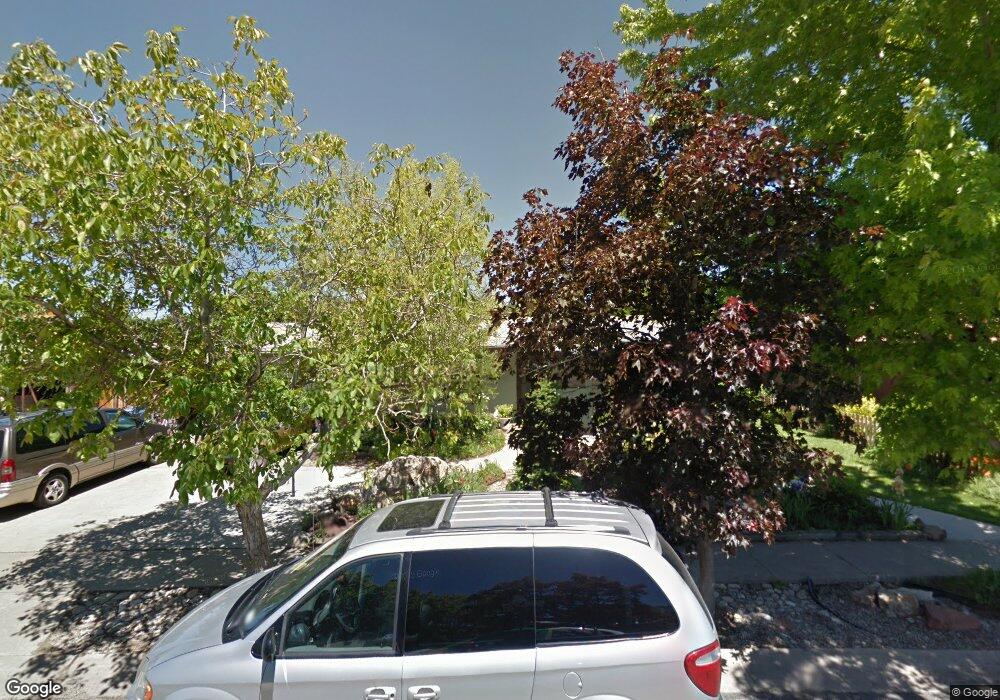
1361 Davis Ave Logan, UT 84321
Hillcrest NeighborhoodEstimated Value: $398,816 - $461,000
Studio
--
Bath
1,176
Sq Ft
$372/Sq Ft
Est. Value
About This Home
This home is located at 1361 Davis Ave, Logan, UT 84321 and is currently estimated at $437,454, approximately $371 per square foot. 1361 Davis Ave is a home with nearby schools including Hillcrest Elementary School, Mount Logan Middle School, and Logan High School.
Ownership History
Date
Name
Owned For
Owner Type
Purchase Details
Closed on
May 27, 2022
Sold by
Brower Family Trust
Bought by
Larson Danet and Larson Steven
Current Estimated Value
Home Financials for this Owner
Home Financials are based on the most recent Mortgage that was taken out on this home.
Original Mortgage
$110,000
Outstanding Balance
$104,104
Interest Rate
5%
Mortgage Type
New Conventional
Estimated Equity
$333,350
Purchase Details
Closed on
Jun 1, 2007
Sold by
Brower Owen James and Brower Myrla T
Bought by
The Brower Family Trust and Brower Owen James
Create a Home Valuation Report for This Property
The Home Valuation Report is an in-depth analysis detailing your home's value as well as a comparison with similar homes in the area
Home Values in the Area
Average Home Value in this Area
Purchase History
| Date | Buyer | Sale Price | Title Company |
|---|---|---|---|
| Larson Danet | -- | Pinnacle Title | |
| The Brower Family Trust | -- | None Available |
Source: Public Records
Mortgage History
| Date | Status | Borrower | Loan Amount |
|---|---|---|---|
| Open | Larson Danet | $110,000 | |
| Closed | Larson Danet | $45,000 |
Source: Public Records
Tax History
| Year | Tax Paid | Tax Assessment Tax Assessment Total Assessment is a certain percentage of the fair market value that is determined by local assessors to be the total taxable value of land and additions on the property. | Land | Improvement |
|---|---|---|---|---|
| 2025 | $1,786 | $231,015 | $0 | $0 |
| 2024 | $1,844 | $231,015 | $0 | $0 |
| 2023 | $1,925 | $229,805 | $0 | $0 |
| 2022 | $1,839 | $205,055 | $0 | $0 |
| 2021 | $1,701 | $293,020 | $65,000 | $228,020 |
| 2020 | $1,551 | $240,400 | $65,000 | $175,400 |
| 2019 | $1,621 | $240,400 | $65,000 | $175,400 |
| 2018 | $1,449 | $196,264 | $65,000 | $131,264 |
| 2017 | $1,254 | $89,760 | $0 | $0 |
| 2016 | $1,300 | $89,760 | $0 | $0 |
| 2015 | $1,301 | $89,760 | $0 | $0 |
| 2014 | $1,176 | $89,760 | $0 | $0 |
| 2013 | -- | $86,225 | $0 | $0 |
Source: Public Records
Map
Nearby Homes
- 866 Hillcrest Ave
- 825 N 1400 E
- 1374 Maple Dr
- 1133 N 1520 E
- 1357 E 1220 N
- 1512 E 1260 N
- 1341 N 1250 E Unit 41
- 1354 N 1250 E Unit 46
- 1374 N 1250 E Unit 48
- 1535 E 1385 N
- 1535 Sumac Dr
- 1454 N 1400 E
- 1336 E Talmage Ln Unit 38
- 1782 E 1250 N
- 1450 N 1525 E
- 1440 N 1600 E
- 1424 N 1640 E
- 1156 Circle View Dr
- 871 N 700 E
- 1387 E 260 N
- 1349 Davis Ave
- 1373 Davis Ave
- 962 Hillcrest Ave
- 1366 E 1000 N
- 1356 Davis Ave
- 976 Hillcrest Ave
- 1368 Davis Ave
- 1378 E 1000 N
- 1378 Davis Ave
- 969 N 1400 E
- 1340 E 1000 N
- 1342 Davis Ave
- 979 N 1400 E
- 1390 Davis Ave
- 926 Hillcrest Ave
- 1390 E 1000 N
- 925 N 1400 E
- 941 Hillcrest Ave
- 1341 E 900 N
- 965 Hillcrest Ave
Your Personal Tour Guide
Ask me questions while you tour the home.