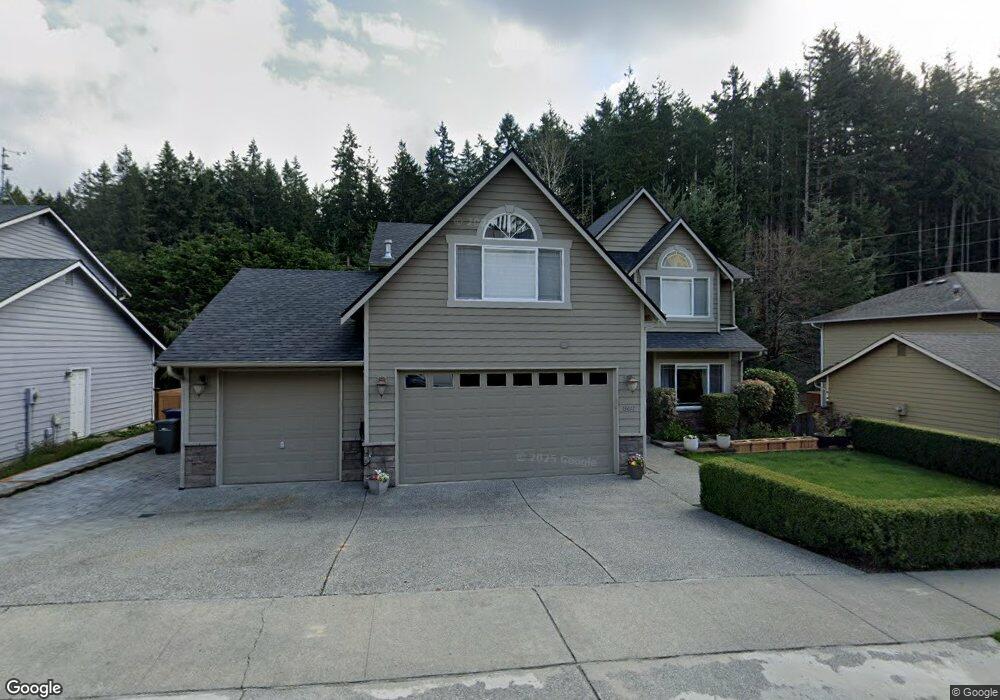
13611 58th Place W Edmonds, WA 98026
Wingate NeighborhoodEstimated Value: $1,039,681 - $1,295,000
5
Beds
3
Baths
2,546
Sq Ft
$437/Sq Ft
Est. Value
About This Home
This home is located at 13611 58th Place W, Edmonds, WA 98026 and is currently estimated at $1,113,420, approximately $437 per square foot. 13611 58th Place W is a home located in Snohomish County with nearby schools including Picnic Point Elementary School, Harbour Pointe Middle School, and Kamiak High School.
Ownership History
Date
Name
Owned For
Owner Type
Purchase Details
Closed on
Jul 12, 2010
Sold by
Onishchuk Petr and Onishchuk Olena
Bought by
Onishchuk Petr and Onishchuk Olena
Current Estimated Value
Home Financials for this Owner
Home Financials are based on the most recent Mortgage that was taken out on this home.
Original Mortgage
$185,300
Outstanding Balance
$60,817
Interest Rate
4.45%
Mortgage Type
New Conventional
Estimated Equity
$1,052,603
Purchase Details
Closed on
Sep 9, 2002
Sold by
Onishcnuk Mikhail and Onishcnuk Lyubov
Bought by
Onishcnuk Petr
Home Financials for this Owner
Home Financials are based on the most recent Mortgage that was taken out on this home.
Original Mortgage
$204,000
Interest Rate
6.37%
Purchase Details
Closed on
Mar 19, 1998
Sold by
Starr Ivan J and Starr Jaelene F
Bought by
Onishcnuk Mikhail and Onishcnuk Petr
Home Financials for this Owner
Home Financials are based on the most recent Mortgage that was taken out on this home.
Original Mortgage
$213,303
Interest Rate
7.02%
Create a Home Valuation Report for This Property
The Home Valuation Report is an in-depth analysis detailing your home's value as well as a comparison with similar homes in the area
Home Values in the Area
Average Home Value in this Area
Purchase History
| Date | Buyer | Sale Price | Title Company |
|---|---|---|---|
| Onishchuk Petr | -- | Lsi | |
| Onishcnuk Petr | -- | -- | |
| Onishcnuk Mikhail | $223,790 | -- |
Source: Public Records
Mortgage History
| Date | Status | Borrower | Loan Amount |
|---|---|---|---|
| Open | Onishchuk Petr | $185,300 | |
| Closed | Onishcnuk Petr | $204,000 | |
| Closed | Onishcnuk Mikhail | $213,303 |
Source: Public Records
Tax History Compared to Growth
Tax History
| Year | Tax Paid | Tax Assessment Tax Assessment Total Assessment is a certain percentage of the fair market value that is determined by local assessors to be the total taxable value of land and additions on the property. | Land | Improvement |
|---|---|---|---|---|
| 2025 | $6,543 | $789,900 | $445,900 | $344,000 |
| 2024 | $6,543 | $774,700 | $430,700 | $344,000 |
| 2023 | $7,143 | $886,800 | $451,100 | $435,700 |
| 2022 | $6,426 | $674,300 | $286,900 | $387,400 |
| 2020 | $5,651 | $577,100 | $244,200 | $332,900 |
| 2019 | $5,401 | $553,800 | $224,200 | $329,600 |
| 2018 | $5,414 | $484,100 | $190,000 | $294,100 |
| 2017 | $4,703 | $429,900 | $175,800 | $254,100 |
| 2016 | $4,378 | $397,300 | $153,900 | $243,400 |
| 2015 | $4,492 | $373,600 | $145,400 | $228,200 |
| 2013 | $3,604 | $279,700 | $109,000 | $170,700 |
Source: Public Records
Map
Nearby Homes
- 13802 60th Ave W
- 6306 141st St SW
- 5119 136th St SW
- 6420 141st St SW
- 6625 136th Place SW
- 14019 52nd Ave W Unit B
- 13813 68th Ave W
- 6122 144th St SW
- 6104 145th St SW
- 6509 128th Place SW
- 6523 128th Place SW
- 5015 144th St SW Unit B1
- 5015 144th St SW Unit A4
- 5015 144th St SW Unit B3
- 5015 144th St SW Unit C1
- 13303 48th Place W
- 14714 53rd Ave W Unit 116
- 14714 53rd Ave W Unit 119
- 4726 Picnic Point Rd
- 14224 Beverly Park Rd Unit A
- 13529 58th Place W Unit 1
- 13521 58th Place W Unit 3
- 13525 58th Place W Unit 2
- 13429 58th Place W
- 13429 58th Place W Unit 9
- 13607 58th Place W
- 13615 58th Place W
- 6018 135th Place SW
- 6029 135th Place SW
- 6028 135th Place SW
- 6104 135th Place SW Unit 77
- 6029 135th Place SW Unit 54
- 6028 135th Place SW Unit 78
- 6026 135th Place SW Unit 79
- 6017 135th Place SW Unit 51
- 6009 135th Place SW Unit 49
- 6025 135th Place SW Unit 53
- 6021 135th Place SW Unit 52
- 6020 135th Place SW Unit 80
- 6010 135th Place SW Unit 83