Estimated Value: $598,000 - $2,268,000
4
Beds
7
Baths
6,580
Sq Ft
$188/Sq Ft
Est. Value
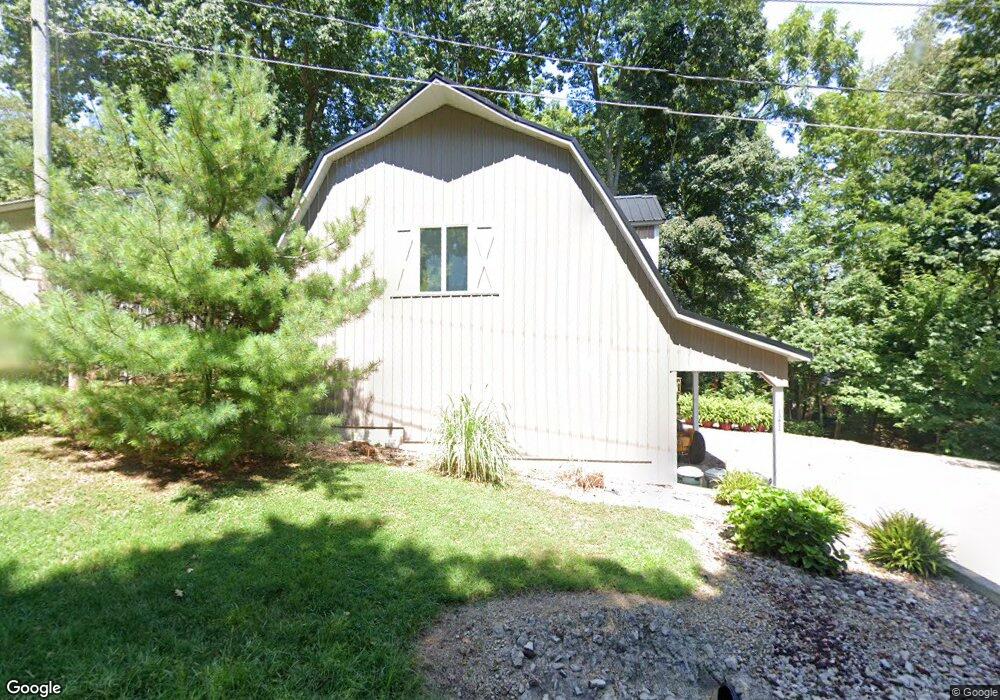
About This Home
This home is located at 13611 Hildebrandt Rd, Logan, OH 43138 and is currently estimated at $1,236,667, approximately $187 per square foot. 13611 Hildebrandt Rd is a home located in Hocking County with nearby schools including Hocking Hills Elementary School, St. John the Evangelist School, and Logan Christian School.
Ownership History
Date
Name
Owned For
Owner Type
Purchase Details
Closed on
Sep 10, 2025
Sold by
Endersby Evelyn Mae
Bought by
Chateau Lake Logan Hh Llc
Current Estimated Value
Purchase Details
Closed on
Oct 9, 2018
Sold by
Walsh Thomas A
Bought by
Endersby Catherine F
Home Financials for this Owner
Home Financials are based on the most recent Mortgage that was taken out on this home.
Original Mortgage
$260,000
Interest Rate
4.5%
Mortgage Type
New Conventional
Purchase Details
Closed on
Mar 7, 2015
Sold by
Endersby Evelyn Mae
Bought by
Brock Jordan Bige
Purchase Details
Closed on
Oct 14, 2008
Sold by
Stiles Holland Lee and Endersby Evelyn Mae
Bought by
Endersby Evelyn Mae
Purchase Details
Closed on
Jul 17, 2006
Sold by
Stiles Lehman G and Stiles Gloria J
Bought by
Stiles Holland Lee and Endersby Evelyn Mae
Create a Home Valuation Report for This Property
The Home Valuation Report is an in-depth analysis detailing your home's value as well as a comparison with similar homes in the area
Home Values in the Area
Average Home Value in this Area
Purchase History
| Date | Buyer | Sale Price | Title Company |
|---|---|---|---|
| Chateau Lake Logan Hh Llc | -- | None Listed On Document | |
| Endersby Catherine F | $325,000 | None Available | |
| Brock Jordan Bige | $11,000 | None Available | |
| Endersby Evelyn Mae | -- | None Available | |
| Stiles Holland Lee | -- | None Available |
Source: Public Records
Mortgage History
| Date | Status | Borrower | Loan Amount |
|---|---|---|---|
| Previous Owner | Endersby Catherine F | $260,000 |
Source: Public Records
Tax History
| Year | Tax Paid | Tax Assessment Tax Assessment Total Assessment is a certain percentage of the fair market value that is determined by local assessors to be the total taxable value of land and additions on the property. | Land | Improvement |
|---|---|---|---|---|
| 2024 | -- | $0 | $0 | $0 |
| 2023 | $13,703 | $357,200 | $38,870 | $318,330 |
| 2022 | $13,725 | $357,200 | $38,870 | $318,330 |
| 2021 | $17,875 | $436,350 | $29,580 | $406,770 |
| 2020 | $15,036 | $368,880 | $29,580 | $339,300 |
| 2019 | $17,557 | $430,310 | $29,580 | $400,730 |
| 2018 | $4,428 | $112,090 | $25,140 | $86,950 |
| 2017 | $3,657 | $94,590 | $25,140 | $69,450 |
| 2016 | $3,444 | $89,820 | $20,370 | $69,450 |
| 2015 | $4,556 | $83,540 | $20,320 | $63,220 |
| 2014 | $4,556 | $113,990 | $26,050 | $87,940 |
| 2013 | $3,329 | $83,010 | $16,880 | $66,130 |
Source: Public Records
Map
Nearby Homes
- 13534 Hildebrandt Rd
- 13493 Hildebrandt Rd
- 29941 Blosser Rd
- 14121 State Route 664 S
- 14180 Ohio 664
- 30483 Lake Logan Rd
- 14509 State Route 664 S
- 14462 Ohio 664
- 1139 Old McArthur Rd
- 0 Evans Rd
- 0 Chieftain Dr
- 30313 Chieftain Dr
- 15050 Old McArthur Rd
- 15155 Sauerkraut Rd
- 0 Ohio 664 Unit Lot 10
- 0 Ohio 664
- 13500 Pleasant Valley Rd
- 14560 Pleasant Valley Rd
- 29593 Big Pine Rd
- 0 Pleasant Valley Rd Unit 225037822
- 13632 Hildebrandt Rd
- 13590 Hildebrandt Rd
- 30036 Vacation Dr
- 30064 Vacation Dr
- Tract 4 Vacation Dr
- 0 Vacation Dr
- 34534 Hildebrand Rd
- 30074 Vacation Dr
- 13709 Hildebrandt Rd
- 13549 Lakefront Dr
- 13537 Lakefront Dr
- 13519 Lakefront Dr
- 13541 Lakefront Dr
- 13662 Lakefront Dr
- 13545 Lakefront Dr
- 13692 Lakefront Dr
- 13737 Hildebrandt Rd
- 13702 Hildebrandt Rd
- 13463 Hildebrandt Rd
- 13720 Hildebrandt Rd
Your Personal Tour Guide
Ask me questions while you tour the home.