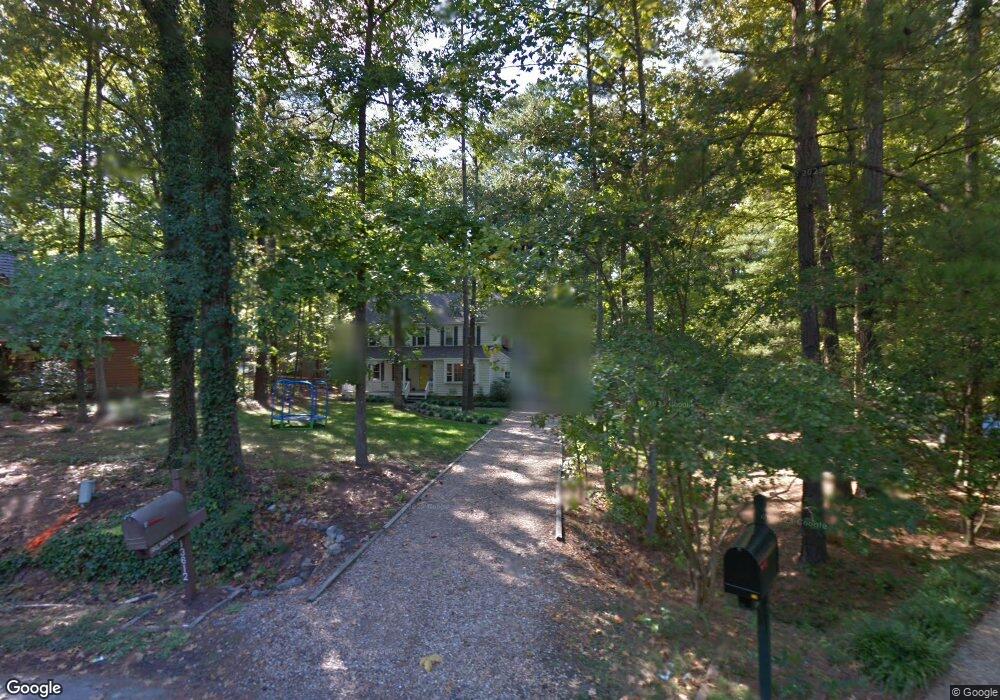
13612 Fox Chase Terrace Midlothian, VA 23112
Estimated Value: $352,000 - $422,000
4
Beds
3
Baths
2,070
Sq Ft
$191/Sq Ft
Est. Value
About This Home
This home is located at 13612 Fox Chase Terrace, Midlothian, VA 23112 and is currently estimated at $396,070, approximately $191 per square foot. 13612 Fox Chase Terrace is a home located in Chesterfield County with nearby schools including Swift Creek Elementary School, Swift Creek Middle, and Clover Hill High.
Ownership History
Date
Name
Owned For
Owner Type
Purchase Details
Closed on
Sep 21, 2018
Sold by
Brennan Chad and Brennan Jennye
Bought by
Mcclendon Ian J
Current Estimated Value
Home Financials for this Owner
Home Financials are based on the most recent Mortgage that was taken out on this home.
Original Mortgage
$163,975
Outstanding Balance
$142,701
Interest Rate
4.5%
Mortgage Type
FHA
Estimated Equity
$253,369
Purchase Details
Closed on
Jul 26, 2001
Sold by
Skelton Morris E
Bought by
Ward John M and Ward Derina G
Home Financials for this Owner
Home Financials are based on the most recent Mortgage that was taken out on this home.
Original Mortgage
$132,000
Interest Rate
7.18%
Mortgage Type
VA
Purchase Details
Closed on
Mar 6, 2001
Sold by
Skelton Karen D
Bought by
Skelton Morris E and Skelton Karen D
Home Financials for this Owner
Home Financials are based on the most recent Mortgage that was taken out on this home.
Original Mortgage
$101,600
Interest Rate
7%
Mortgage Type
New Conventional
Create a Home Valuation Report for This Property
The Home Valuation Report is an in-depth analysis detailing your home's value as well as a comparison with similar homes in the area
Home Values in the Area
Average Home Value in this Area
Purchase History
| Date | Buyer | Sale Price | Title Company |
|---|---|---|---|
| Mcclendon Ian J | $167,000 | Attorney | |
| Ward John M | $129,450 | -- | |
| Skelton Morris E | -- | -- |
Source: Public Records
Mortgage History
| Date | Status | Borrower | Loan Amount |
|---|---|---|---|
| Open | Mcclendon Ian J | $163,975 | |
| Previous Owner | Skelton Morris E | $132,000 | |
| Previous Owner | Skelton Morris E | $101,600 |
Source: Public Records
Tax History Compared to Growth
Tax History
| Year | Tax Paid | Tax Assessment Tax Assessment Total Assessment is a certain percentage of the fair market value that is determined by local assessors to be the total taxable value of land and additions on the property. | Land | Improvement |
|---|---|---|---|---|
| 2025 | $3,165 | $352,800 | $78,000 | $274,800 |
| 2024 | $3,165 | $343,100 | $78,000 | $265,100 |
| 2023 | $2,906 | $319,300 | $72,000 | $247,300 |
| 2022 | $2,687 | $292,100 | $63,000 | $229,100 |
| 2021 | $2,538 | $260,200 | $61,000 | $199,200 |
| 2020 | $2,374 | $249,900 | $60,000 | $189,900 |
| 2019 | $2,293 | $241,400 | $58,000 | $183,400 |
| 2018 | $2,158 | $227,800 | $55,000 | $172,800 |
| 2017 | $2,102 | $213,700 | $52,000 | $161,700 |
| 2016 | $2,009 | $209,300 | $52,000 | $157,300 |
| 2015 | $1,957 | $201,200 | $46,500 | $154,700 |
| 2014 | $1,901 | $195,400 | $46,500 | $148,900 |
Source: Public Records
Map
Nearby Homes
- 3114 Fox Chase Dr
- 3200 Hunts Bridge Ct
- 3208 Quail Hill Dr
- 3207 Quail Hill Dr
- 3401 Quail Hill Dr
- 13700 Quail Meadows Ln
- 3301 Old Hundred Rd S
- 3601 Quail Meadows Place
- 3006 Three Bridges Rd
- 13712 Woodbridge Crossing Way
- 2980 Woodbridge Crossing Dr
- 2800 Fox Chase Ln
- 3319 Seven Oaks Terrace
- 13931 Sagegrove Cir
- 4018 Timber Ridge Rd
- 12918 Mill Meadow Ct
- 12760 Forest Mill Dr
- 12548 Petrel Crossing
- 12576 Petrel Crossing
- 2411 Arrowood Rd
- 13610 Fox Chase Terrace
- 3209 Fox Chase Dr
- 13613 Fox Chase Terrace
- 3207 Fox Chase Dr
- 13611 Fox Chase Terrace
- 13608 Fox Chase Terrace
- 3213 Fox Chase Dr
- 13603 Hunts Bridge Rd
- 3203 Fox Chase Dr
- 13609 Fox Chase Terrace
- 3215 Fox Chase Dr
- 13620 Hunts Bridge Rd
- 13621 Hunts Bridge Rd
- 13606 Fox Chase Terrace
- 3208 Fox Chase Dr
- 3303 Fox Chase Dr
- 3206 Fox Chase Dr
- 3301 Fox Chase Dr
- 13607 Fox Chase Terrace
- 3305 Fox Chase Dr