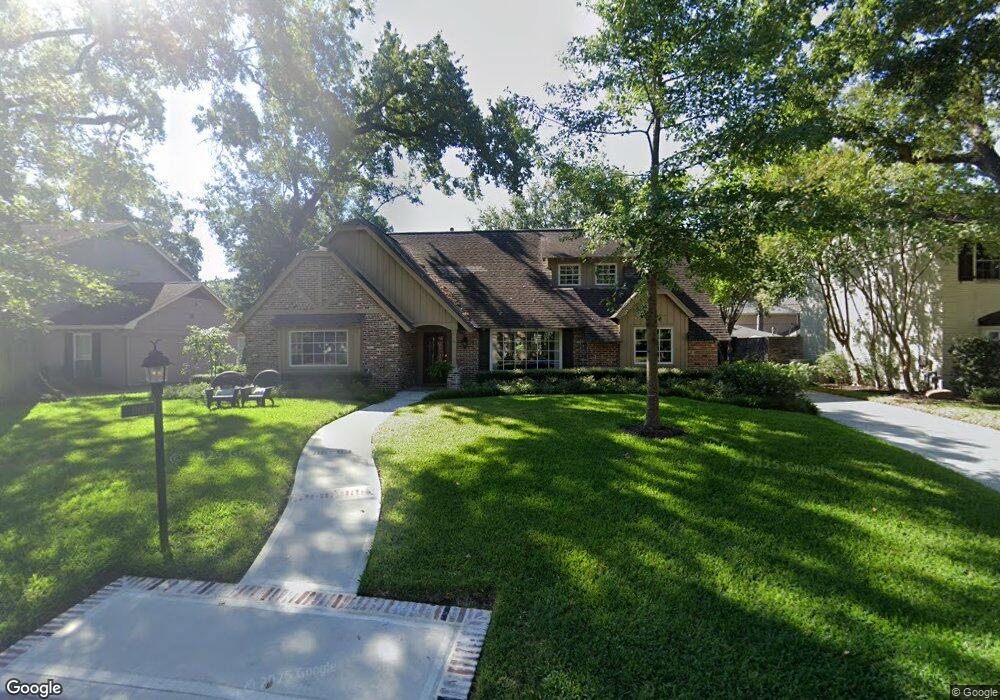
13619 Pebblebrook Dr Houston, TX 77079
Memorial NeighborhoodEstimated Value: $1,084,000 - $1,207,000
4
Beds
5
Baths
3,316
Sq Ft
$344/Sq Ft
Est. Value
About This Home
This home is located at 13619 Pebblebrook Dr, Houston, TX 77079 and is currently estimated at $1,141,750, approximately $344 per square foot. 13619 Pebblebrook Dr is a home located in Harris County with nearby schools including Wilchester Elementary School, Memorial Middle, and Stratford High School.
Ownership History
Date
Name
Owned For
Owner Type
Purchase Details
Closed on
May 22, 1997
Sold by
Prudential Residential Svcs Ltd Prtnrshp
Bought by
Whitten Kent F and Whitten Bonnie L
Current Estimated Value
Home Financials for this Owner
Home Financials are based on the most recent Mortgage that was taken out on this home.
Original Mortgage
$214,600
Outstanding Balance
$29,825
Interest Rate
8.17%
Estimated Equity
$1,111,925
Purchase Details
Closed on
Dec 20, 1996
Sold by
Raynaud Beverly W
Bought by
Messer Jeffery B and Messer Susan K
Home Financials for this Owner
Home Financials are based on the most recent Mortgage that was taken out on this home.
Original Mortgage
$158,000
Interest Rate
7.71%
Create a Home Valuation Report for This Property
The Home Valuation Report is an in-depth analysis detailing your home's value as well as a comparison with similar homes in the area
Home Values in the Area
Average Home Value in this Area
Purchase History
| Date | Buyer | Sale Price | Title Company |
|---|---|---|---|
| Whitten Kent F | -- | Texas American Title Co | |
| Messer Jeffery B | -- | Texas American Title Company |
Source: Public Records
Mortgage History
| Date | Status | Borrower | Loan Amount |
|---|---|---|---|
| Open | Whitten Kent F | $214,600 | |
| Previous Owner | Messer Jeffery B | $158,000 |
Source: Public Records
Tax History Compared to Growth
Tax History
| Year | Tax Paid | Tax Assessment Tax Assessment Total Assessment is a certain percentage of the fair market value that is determined by local assessors to be the total taxable value of land and additions on the property. | Land | Improvement |
|---|---|---|---|---|
| 2025 | $12,477 | $1,227,058 | $506,250 | $720,808 |
| 2024 | $12,477 | $1,090,987 | $506,250 | $584,737 |
| 2023 | $12,477 | $1,083,248 | $506,250 | $576,998 |
| 2022 | $22,562 | $1,094,766 | $480,938 | $613,828 |
| 2021 | $21,419 | $877,300 | $464,063 | $413,237 |
| 2020 | $21,692 | $865,756 | $464,063 | $401,693 |
| 2019 | $23,562 | $900,000 | $464,063 | $435,937 |
| 2018 | $8,807 | $899,737 | $464,063 | $435,674 |
| 2017 | $23,421 | $972,931 | $464,063 | $508,868 |
| 2016 | $21,292 | $972,931 | $464,063 | $508,868 |
| 2015 | $14,113 | $885,841 | $464,063 | $421,778 |
| 2014 | $14,113 | $754,211 | $320,625 | $433,586 |
Source: Public Records
Map
Nearby Homes
- 13403 Taylorcrest Rd
- 710 Patchester Dr
- 807 Patchester Dr
- 807 Wycliffe Dr
- 334 Wycliffe Dr
- 13131 Kimberley Ln
- 414 E Gaywood Dr
- 903 Wycliffe Dr
- 13931 Kingsride Ln
- 866 Myrtlea Ln
- 881 Wax Myrtle Ln Unit A
- 14135 Kimberley Ln
- 839 Wax Myrtle Ln
- 14122 Barryknoll Ln
- 1110 W Tri Oaks Ln Unit 157
- 0 White Wing Ln
- 14111 Cindywood Cir
- 921 Wax Myrtle Ln
- 939 Wax Myrtle Ln
- 903 Wax Myrtle Ln
- 13623 Pebblebrook Dr
- 13615 Pebblebrook Dr
- 13618 Taylorcrest Rd
- 13622 Taylorcrest Rd
- 13614 Taylorcrest Rd
- 13627 Pebblebrook Dr
- 13611 Pebblebrook Dr
- 13618 Pebblebrook Dr
- 13626 Taylorcrest Rd
- 13602 Pebblebrook Dr
- 13622 Pebblebrook Dr
- 13610 Taylorcrest Rd
- 13631 Pebblebrook Dr
- 13626 Pebblebrook Dr
- 13630 Taylorcrest Rd
- 13603 Perthshire Rd
- 13606 Taylorcrest Rd
- 13607 Pebblebrook Dr
- 13619 Taylorcrest Rd
- 13630 Pebblebrook Dr