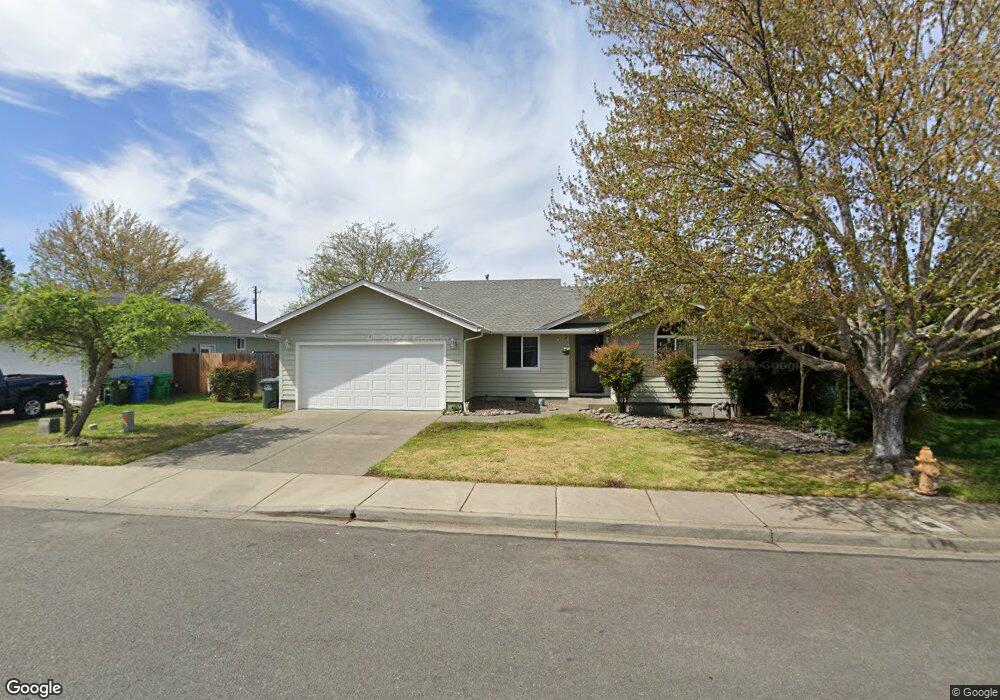
1362 Abby Ln Grants Pass, OR 97527
Estimated Value: $344,082 - $354,000
3
Beds
2
Baths
1,344
Sq Ft
$260/Sq Ft
Est. Value
About This Home
This home is located at 1362 Abby Ln, Grants Pass, OR 97527 and is currently estimated at $349,041, approximately $259 per square foot. 1362 Abby Ln is a home located in Josephine County with nearby schools including Redwood Elementary School, South Middle School, and Grants Pass High School.
Ownership History
Date
Name
Owned For
Owner Type
Purchase Details
Closed on
Nov 2, 2007
Sold by
Oldham Jack
Bought by
Oldham Jack and Oldham Jennet
Current Estimated Value
Home Financials for this Owner
Home Financials are based on the most recent Mortgage that was taken out on this home.
Original Mortgage
$212,500
Outstanding Balance
$132,597
Interest Rate
6.29%
Mortgage Type
New Conventional
Estimated Equity
$216,444
Purchase Details
Closed on
Oct 30, 2007
Sold by
Oldham Jack and Oldham Jennet
Bought by
Oldham Jack
Home Financials for this Owner
Home Financials are based on the most recent Mortgage that was taken out on this home.
Original Mortgage
$212,500
Outstanding Balance
$132,597
Interest Rate
6.29%
Mortgage Type
New Conventional
Estimated Equity
$216,444
Purchase Details
Closed on
Jul 20, 2005
Sold by
Paradise Laurel
Bought by
Oldham Jack and Oldham Jennet
Home Financials for this Owner
Home Financials are based on the most recent Mortgage that was taken out on this home.
Original Mortgage
$204,250
Interest Rate
6.99%
Mortgage Type
Fannie Mae Freddie Mac
Create a Home Valuation Report for This Property
The Home Valuation Report is an in-depth analysis detailing your home's value as well as a comparison with similar homes in the area
Home Values in the Area
Average Home Value in this Area
Purchase History
| Date | Buyer | Sale Price | Title Company |
|---|---|---|---|
| Oldham Jack | -- | Ticor Title | |
| Oldham Jack | -- | Ticor Title | |
| Oldham Jack | $215,000 | Ticor Title |
Source: Public Records
Mortgage History
| Date | Status | Borrower | Loan Amount |
|---|---|---|---|
| Open | Oldham Jack | $212,500 | |
| Closed | Oldham Jack | $204,250 |
Source: Public Records
Tax History Compared to Growth
Tax History
| Year | Tax Paid | Tax Assessment Tax Assessment Total Assessment is a certain percentage of the fair market value that is determined by local assessors to be the total taxable value of land and additions on the property. | Land | Improvement |
|---|---|---|---|---|
| 2025 | $2,584 | $198,960 | -- | -- |
| 2024 | $2,584 | $193,170 | -- | -- |
| 2023 | $2,434 | $187,550 | $0 | $0 |
| 2022 | $2,445 | $182,090 | -- | -- |
| 2021 | $2,297 | $176,790 | $0 | $0 |
| 2020 | $2,230 | $171,650 | $0 | $0 |
| 2019 | $2,166 | $166,660 | $0 | $0 |
| 2018 | $2,204 | $161,810 | $0 | $0 |
| 2017 | $2,188 | $157,100 | $0 | $0 |
| 2016 | $1,923 | $152,530 | $0 | $0 |
| 2015 | $1,822 | $148,090 | $0 | $0 |
| 2014 | $1,766 | $143,780 | $0 | $0 |
Source: Public Records
Map
Nearby Homes
- 1418 Redfin Ln
- 973 SW Blackberry Ln
- 1307 SW Sturgeon Ct
- 2387 Mulberry Ct
- 2372 Sequoia Ct
- 142 SW Jenn Way
- 2398 Sasha Ct
- 2344 Redwood Ave
- 2720 Redwood Ave
- 1061 Rainwood Ln
- 1510 Agape Way
- 1504 Agape Way
- 1505 Agape Way
- 1512 Agape Way
- 1509 Agape Way
- 208 SW Blueberry Ln
- 2687 Sprinkle Way
- 2774 Tyee Ct
- 2659 Esther Ln
- 1630 Medart Ln