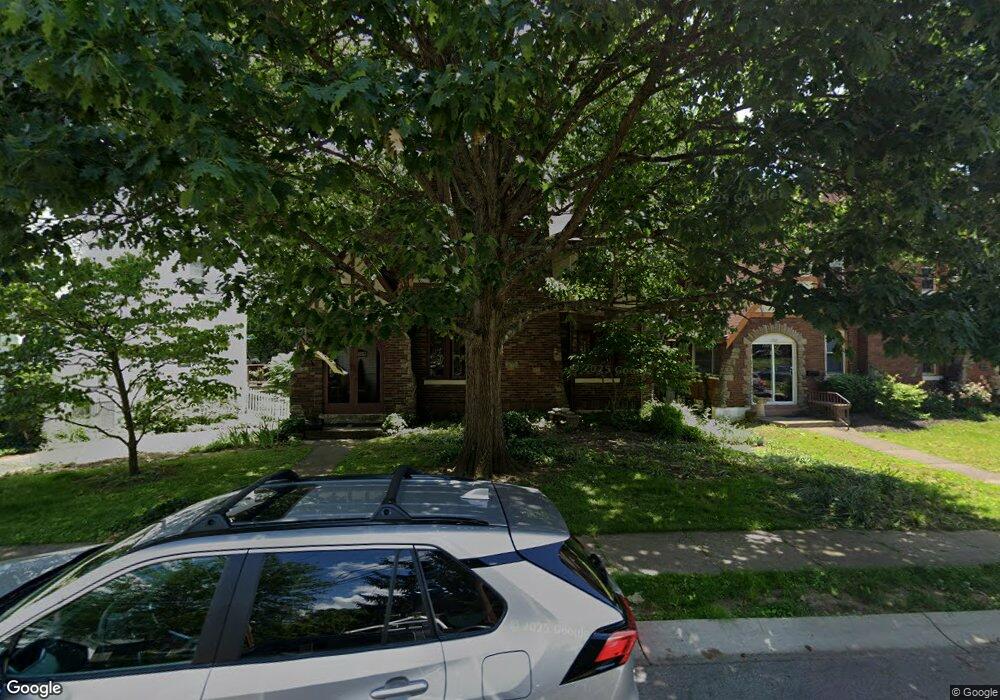
1362 Herlin Place Cincinnati, OH 45208
Mount Lookout NeighborhoodEstimated Value: $414,000 - $583,000
3
Beds
4
Baths
1,774
Sq Ft
$300/Sq Ft
Est. Value
About This Home
This home is located at 1362 Herlin Place, Cincinnati, OH 45208 and is currently estimated at $532,298, approximately $300 per square foot. 1362 Herlin Place is a home located in Hamilton County with nearby schools including Kilgour Elementary School, Clark Montessori High School, and Shroder High School.
Ownership History
Date
Name
Owned For
Owner Type
Purchase Details
Closed on
Sep 7, 2023
Sold by
James C Bartlett Amended And Restated Tr
Bought by
Wieland Adam
Current Estimated Value
Home Financials for this Owner
Home Financials are based on the most recent Mortgage that was taken out on this home.
Original Mortgage
$400,000
Interest Rate
6.81%
Mortgage Type
New Conventional
Purchase Details
Closed on
Mar 15, 2006
Sold by
Bartlett Holly E
Bought by
Bartlett Holly E and James C Bartlett Amended & Restated Tr
Purchase Details
Closed on
Sep 5, 1996
Sold by
Bartlett Holly E
Bought by
Bartlett Holly E and Bartlett James C
Purchase Details
Closed on
Sep 4, 1996
Sold by
Bartlett James C
Bought by
Bartlett Holly E
Create a Home Valuation Report for This Property
The Home Valuation Report is an in-depth analysis detailing your home's value as well as a comparison with similar homes in the area
Home Values in the Area
Average Home Value in this Area
Purchase History
| Date | Buyer | Sale Price | Title Company |
|---|---|---|---|
| Wieland Adam | $400,000 | None Listed On Document | |
| Bartlett Holly E | -- | None Available | |
| Bartlett Holly E | -- | -- | |
| Bartlett Holly E | -- | -- |
Source: Public Records
Mortgage History
| Date | Status | Borrower | Loan Amount |
|---|---|---|---|
| Previous Owner | Wieland Adam | $400,000 |
Source: Public Records
Tax History Compared to Growth
Tax History
| Year | Tax Paid | Tax Assessment Tax Assessment Total Assessment is a certain percentage of the fair market value that is determined by local assessors to be the total taxable value of land and additions on the property. | Land | Improvement |
|---|---|---|---|---|
| 2024 | $7,842 | $131,279 | $41,647 | $89,632 |
| 2023 | $8,019 | $131,279 | $41,647 | $89,632 |
| 2022 | $8,638 | $126,876 | $39,491 | $87,385 |
| 2021 | $8,313 | $126,876 | $39,491 | $87,385 |
| 2020 | $8,557 | $126,876 | $39,491 | $87,385 |
| 2019 | $7,996 | $108,441 | $33,754 | $74,687 |
| 2018 | $7,356 | $108,441 | $33,754 | $74,687 |
| 2017 | $6,980 | $108,441 | $33,754 | $74,687 |
| 2016 | $6,445 | $99,610 | $31,059 | $68,551 |
| 2015 | $6,390 | $99,610 | $31,059 | $68,551 |
| 2014 | $6,436 | $99,610 | $31,059 | $68,551 |
| 2013 | $6,178 | $93,972 | $29,302 | $64,670 |
Source: Public Records
Map
Nearby Homes
- 1141 Herschel Ave
- 1123 Salisbury Dr
- 3306 Lambert Place
- 3293 Linwood Ave
- 3512 Linwood Ave
- 1221 Herschel Woods Ln
- 3255 Linwood Ave
- 3541 Linwood Ave
- 1065 Delta Ave
- 3548 Linwood Ave
- 3550 Linwood Ave
- 4926 Le Blond Ave
- 1137 Delta Ave
- 3161 Niles St
- 1050 Richwood Ave
- 1332 Herschel Ave
- 1225 Corbett St
- 1029 Kinmont St
- 1227 Corbett St
- 3122 Kinmont St
- 3343 Lookout Dr
- 1358 Herlin Place
- 1358 Herlin Place Unit 2nd
- 1358 Herlin Place Unit 2nd Floor
- 1358 Herlin Place Unit 1 st
- 1354 Herlin Place
- 3325 Lookout Dr
- 1163 Herschel Ave
- 1350 Herlin Place
- 1145 Herschel Ave
- 1149 Herschel Ave
- 1137 Herschel Ave
- 3319 Lookout Dr
- 1349 Herlin Place
- 3334 Lookout Dr
- 3334 Lookout Dr
- 1346 Herlin Place
- 1346 Herlin Place Unit 2
- 1346 Herlin Place Unit 1
- 3330 Lookout Dr