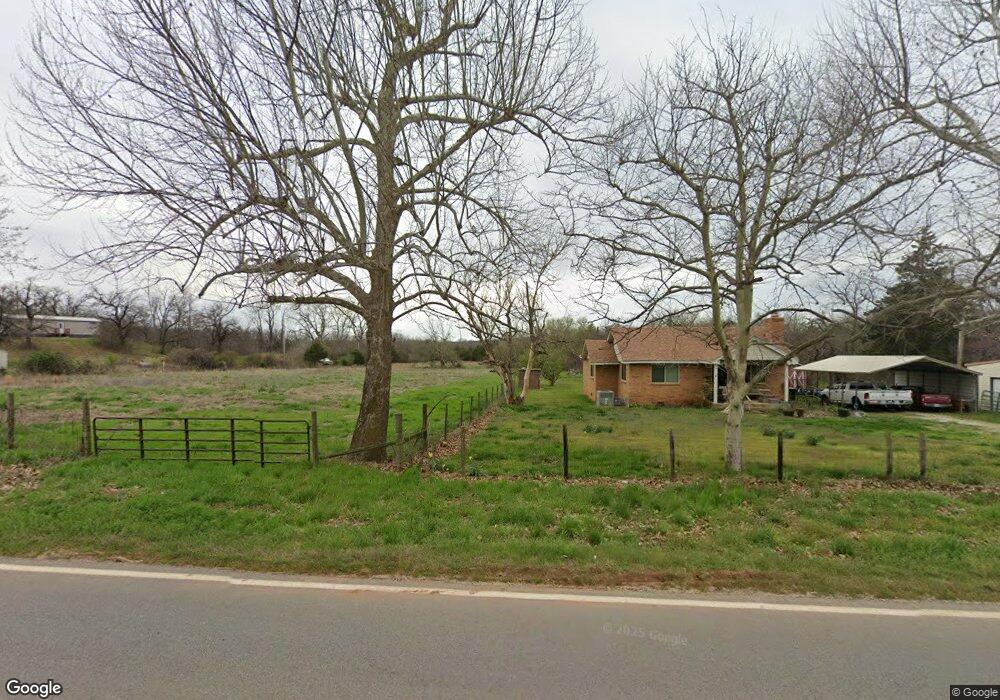
13621 S Peebly Rd Newalla, OK 74857
Estimated Value: $218,843 - $262,000
3
Beds
2
Baths
3,092
Sq Ft
$76/Sq Ft
Est. Value
About This Home
This home is located at 13621 S Peebly Rd, Newalla, OK 74857 and is currently estimated at $235,281, approximately $76 per square foot. 13621 S Peebly Rd is a home located in Cleveland County with nearby schools including Little Axe Elementary School, Little Axe Middle School, and Little Axe High School.
Ownership History
Date
Name
Owned For
Owner Type
Purchase Details
Closed on
Jun 4, 2013
Sold by
Howell Michael Scott and Howell Debra Jean
Bought by
Howell Michael and Howell Debra
Current Estimated Value
Purchase Details
Closed on
May 2, 2013
Sold by
Howell Debra Jean and Howell Michael Scott
Bought by
Howell Michael Scott and Howell Debra Jean
Purchase Details
Closed on
Jul 15, 2009
Sold by
Secretary Of Housing & Urban Development
Bought by
Howell Debra Jean
Home Financials for this Owner
Home Financials are based on the most recent Mortgage that was taken out on this home.
Original Mortgage
$58,500
Interest Rate
5.71%
Mortgage Type
New Conventional
Purchase Details
Closed on
Nov 20, 2008
Sold by
Johnson Douglas W and Johnson Carol J
Bought by
Secretary Of Housing & Urban Development
Purchase Details
Closed on
Jun 30, 2004
Sold by
Shipman Randall L
Bought by
Johnson Douglas W
Create a Home Valuation Report for This Property
The Home Valuation Report is an in-depth analysis detailing your home's value as well as a comparison with similar homes in the area
Home Values in the Area
Average Home Value in this Area
Purchase History
| Date | Buyer | Sale Price | Title Company |
|---|---|---|---|
| Howell Michael | -- | None Available | |
| Howell Michael Scott | -- | None Available | |
| Howell Debra Jean | -- | None Available | |
| Secretary Of Housing & Urban Development | $95,685 | None Available | |
| Johnson Douglas W | $101,000 | -- |
Source: Public Records
Mortgage History
| Date | Status | Borrower | Loan Amount |
|---|---|---|---|
| Previous Owner | Howell Debra Jean | $58,500 |
Source: Public Records
Tax History Compared to Growth
Tax History
| Year | Tax Paid | Tax Assessment Tax Assessment Total Assessment is a certain percentage of the fair market value that is determined by local assessors to be the total taxable value of land and additions on the property. | Land | Improvement |
|---|---|---|---|---|
| 2024 | $746 | $9,695 | $2,751 | $6,944 |
| 2023 | $887 | $9,413 | $2,419 | $6,994 |
| 2022 | $900 | $9,413 | $2,419 | $6,994 |
| 2021 | $903 | $9,413 | $2,419 | $6,994 |
| 2020 | $936 | $9,413 | $2,419 | $6,994 |
| 2019 | $953 | $9,413 | $2,419 | $6,994 |
| 2018 | $989 | $9,413 | $2,419 | $6,994 |
| 2017 | $982 | $9,413 | $0 | $0 |
| 2016 | $853 | $9,413 | $2,419 | $6,994 |
| 2015 | $836 | $9,413 | $2,419 | $6,994 |
| 2014 | $836 | $9,413 | $2,419 | $6,994 |
Source: Public Records
Map
Nearby Homes
- 13901 Andrew Ln
- 13901 E Andrew Ln
- 80 SE 149th St
- 14401 Amy Ln
- 14901 Amy Ln
- 14451 Amy Ln
- 14900 Amy Ln
- 14501 Amy Ln
- 0 S Peebly Rd
- 17455 Wing Elm Dr
- 18500 SE 149th St
- 14180 E Deer Creek Rd
- 17194 SE 149th St
- 19201 SE 134th St
- 12720 S Peebly Rd
- 12724 S Peebly Rd
- 12720 S Peebly Rd Unit Tract4
- 12724 S Peebly Rd Unit Tract1B
- 19244 SE 144th St
- 15909 Oakside Dr
- 13700 S Peebly Rd
- 17900 SE 134th St
- 13925 S Peebly Rd
- 13908 S Peebly Rd
- 0 SE 134th St
- 18120 Oakhill Dr
- 14013 S Peebly Rd
- 18111 Oakhill Dr
- 17800 SE 134th St
- 18220 Oakhill Dr
- 13700 Oakhill Dr
- 17805 Thunderbird Hills Rd
- 17700 SE 134th St
- 17800 Thunderbird Hills Rd
- 13421 S Peebly Rd
- 18120 Cedar Ln
- 17836 Thunderbird Hills Rd
- 14200 S Peebly Rd
- 13201 S Peebly Rd
- 18200 Cedar Ln