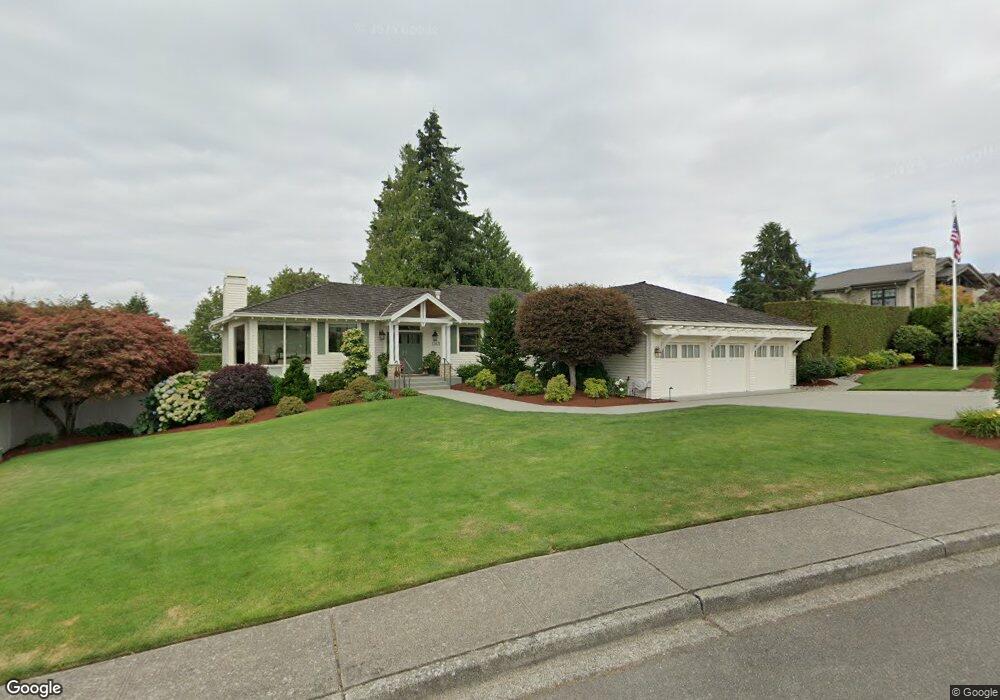
1363 91st Ave NE Clyde Hill, WA 98004
Estimated Value: $4,685,160 - $5,422,000
3
Beds
4
Baths
3,860
Sq Ft
$1,313/Sq Ft
Est. Value
About This Home
This home is located at 1363 91st Ave NE, Clyde Hill, WA 98004 and is currently estimated at $5,068,290, approximately $1,313 per square foot. 1363 91st Ave NE is a home located in King County with nearby schools including Medina Elementary School, Chinook Middle School, and Bellevue High School.
Ownership History
Date
Name
Owned For
Owner Type
Purchase Details
Closed on
Jun 19, 2007
Sold by
Paisley David D and Paisley Wendy H
Bought by
Hovind David J
Current Estimated Value
Home Financials for this Owner
Home Financials are based on the most recent Mortgage that was taken out on this home.
Original Mortgage
$300,000
Outstanding Balance
$182,871
Interest Rate
6.12%
Mortgage Type
Purchase Money Mortgage
Estimated Equity
$4,885,419
Purchase Details
Closed on
Jun 25, 2002
Sold by
Fuerst Richard W
Bought by
Paisley David D and Paisley Wendy H
Home Financials for this Owner
Home Financials are based on the most recent Mortgage that was taken out on this home.
Original Mortgage
$740,000
Interest Rate
5.37%
Purchase Details
Closed on
Apr 7, 1995
Sold by
Sutherland M Sandra and Sutherland Wallace F
Bought by
Sutherland M Sandra
Create a Home Valuation Report for This Property
The Home Valuation Report is an in-depth analysis detailing your home's value as well as a comparison with similar homes in the area
Home Values in the Area
Average Home Value in this Area
Purchase History
| Date | Buyer | Sale Price | Title Company |
|---|---|---|---|
| Hovind David J | $2,730,000 | Chicago Title | |
| Paisley David D | $925,000 | Chicago Title | |
| Sutherland M Sandra | -- | Pioneer National Title Ins C |
Source: Public Records
Mortgage History
| Date | Status | Borrower | Loan Amount |
|---|---|---|---|
| Open | Hovind David J | $300,000 | |
| Previous Owner | Paisley David D | $740,000 |
Source: Public Records
Tax History Compared to Growth
Tax History
| Year | Tax Paid | Tax Assessment Tax Assessment Total Assessment is a certain percentage of the fair market value that is determined by local assessors to be the total taxable value of land and additions on the property. | Land | Improvement |
|---|---|---|---|---|
| 2024 | $30,928 | $4,655,000 | $3,148,000 | $1,507,000 |
| 2023 | $29,571 | $4,134,000 | $2,937,000 | $1,197,000 |
| 2022 | $26,450 | $4,672,000 | $3,275,000 | $1,397,000 |
| 2021 | $25,086 | $3,420,000 | $2,474,000 | $946,000 |
| 2020 | $25,178 | $2,995,000 | $2,167,000 | $828,000 |
| 2018 | $27,180 | $3,560,000 | $1,629,000 | $1,931,000 |
| 2017 | $22,243 | $3,172,000 | $1,452,000 | $1,720,000 |
| 2016 | $21,379 | $2,770,000 | $1,335,000 | $1,435,000 |
| 2015 | $20,356 | $2,563,000 | $1,235,000 | $1,328,000 |
| 2014 | -- | $2,419,000 | $1,167,000 | $1,252,000 |
| 2013 | -- | $2,092,000 | $1,027,000 | $1,065,000 |
Source: Public Records
Map
Nearby Homes
- 1322 91st Ave NE
- 9001 NE 14th St
- 1055 91st Ave NE
- 1028 89th Ave NE
- 8622 NE 10th St
- 9501 NE 13th St
- 9135 NE 19th St
- 805 92nd Ave NE
- 8638 NE 19th Place
- 9426 Lake Washington Blvd NE
- 9820 NE 16th St
- 1702 99th Ave NE
- 2305 88th Ave NE
- 450 Overlake Dr E
- 10001 NE 12th St Unit B110
- 9827 NE 20th St
- 1218 101st Place NE
- 1331 102nd Ave NE
- 10045 NE 15th St
- 9813 NE 21st St
- 1365 91st Ave NE
- 8940 NE 13th St
- 1301 91st Ave NE
- 1300 91st Ave NE
- 8930 NE 13th St
- 8859 NE 14th St
- 1364 91st Ave NE
- 9023 NE 14th St
- 8931 NE 14th St
- 1366 91st Ave NE
- 9118 NE 13th St
- 8919 NE 14th St
- 8920 NE 13th St
- 8949 NE 13th St
- 1353 92nd Ave NE
- 9101 NE 13th St
- 1365 92nd Ave NE
- 8935 NE 13th St
- 9026 NE 14th St
- 1401 92nd Ave NE