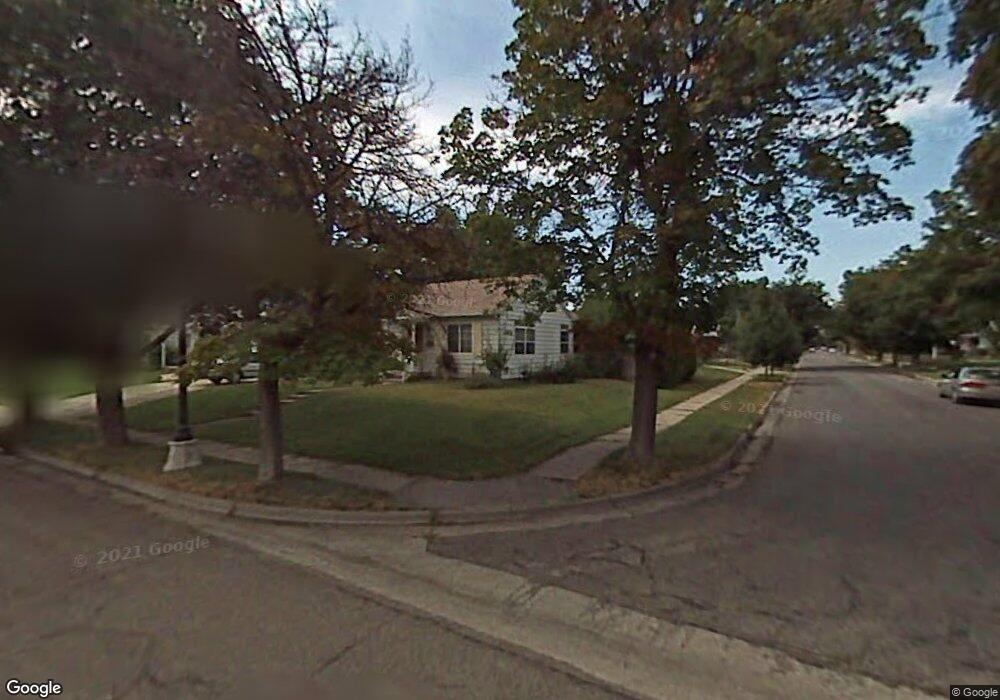
1363 E Claybourne Ave Salt Lake City, UT 84106
Sugar House NeighborhoodEstimated Value: $577,975 - $671,000
3
Beds
2
Baths
1,408
Sq Ft
$441/Sq Ft
Est. Value
About This Home
This home is located at 1363 E Claybourne Ave, Salt Lake City, UT 84106 and is currently estimated at $620,494, approximately $440 per square foot. 1363 E Claybourne Ave is a home located in Salt Lake County with nearby schools including Highland Park Elementary School, Hillside Middle School, and Highland High School.
Ownership History
Date
Name
Owned For
Owner Type
Purchase Details
Closed on
Jul 20, 2020
Sold by
Dickson Chester E and Dickson Diane M
Bought by
Johnson Wayne and Row Heather
Current Estimated Value
Home Financials for this Owner
Home Financials are based on the most recent Mortgage that was taken out on this home.
Original Mortgage
$270,000
Outstanding Balance
$239,862
Interest Rate
3.2%
Mortgage Type
New Conventional
Estimated Equity
$380,632
Purchase Details
Closed on
Jul 17, 2003
Sold by
Murphy David G and Murphy Cindy
Bought by
Dickson Chester E and Dickson Diane M
Purchase Details
Closed on
Nov 16, 1998
Sold by
Keller John D and Keller Melanie Gunne
Bought by
Murphy David G and Murphy Cindy
Home Financials for this Owner
Home Financials are based on the most recent Mortgage that was taken out on this home.
Original Mortgage
$134,900
Interest Rate
6.54%
Purchase Details
Closed on
Mar 15, 1994
Sold by
Sundwall Peter V and Sundwall Michelle
Bought by
Keller Johnd and Keller Melanie Gunne
Home Financials for this Owner
Home Financials are based on the most recent Mortgage that was taken out on this home.
Original Mortgage
$104,500
Interest Rate
7%
Create a Home Valuation Report for This Property
The Home Valuation Report is an in-depth analysis detailing your home's value as well as a comparison with similar homes in the area
Home Values in the Area
Average Home Value in this Area
Purchase History
| Date | Buyer | Sale Price | Title Company |
|---|---|---|---|
| Johnson Wayne | -- | First American Title | |
| Dickson Chester E | -- | Backman Stewart Title Svcs | |
| Murphy David G | -- | -- | |
| Keller Johnd | -- | -- |
Source: Public Records
Mortgage History
| Date | Status | Borrower | Loan Amount |
|---|---|---|---|
| Open | Johnson Wayne | $270,000 | |
| Previous Owner | Murphy David G | $134,900 | |
| Previous Owner | Keller Johnd | $104,500 |
Source: Public Records
Tax History Compared to Growth
Tax History
| Year | Tax Paid | Tax Assessment Tax Assessment Total Assessment is a certain percentage of the fair market value that is determined by local assessors to be the total taxable value of land and additions on the property. | Land | Improvement |
|---|---|---|---|---|
| 2025 | $2,465 | $487,600 | $180,600 | $307,000 |
| 2024 | $2,465 | $470,400 | $175,100 | $295,300 |
| 2023 | $2,307 | $424,300 | $144,700 | $279,600 |
| 2022 | $2,574 | $444,100 | $141,900 | $302,200 |
| 2021 | $2,274 | $355,200 | $109,100 | $246,100 |
| 2020 | $2,210 | $328,700 | $100,000 | $228,700 |
| 2019 | $2,046 | $286,200 | $93,800 | $192,400 |
| 2018 | $0 | $261,800 | $93,800 | $168,000 |
| 2017 | $1,979 | $252,600 | $93,800 | $158,800 |
| 2016 | $1,823 | $220,900 | $93,800 | $127,100 |
| 2015 | $1,837 | $211,100 | $92,800 | $118,300 |
| 2014 | $1,771 | $201,800 | $91,000 | $110,800 |
Source: Public Records
Map
Nearby Homes
- 2865 S 1335 E
- 2760 S Highland Dr Unit 21
- 1314 E Crandall Ave
- 1371 E Zenith Ave
- 2710 S Highland Dr Unit 11
- 1190 E 2700 S Unit A4
- 1190 E 2700 S Unit A1
- 1192 E 2700 S
- 1152 E 2700 S Unit S148
- 1150 E 2700 S Unit G51
- 1150 E 2700 S Unit 50G
- 1130 E 2700 S Unit K83
- 2970 S Richmond St
- 1582 E Zenith Ave
- 2618 S 1100 E
- 3026 S Crescent Dr
- 2795 S Imperial St
- 2477 S Douglas St
- 1168 E Parkway Ave
- 2430 S Elizabeth St Unit 5
- 1359 E Claybourne Ave
- 2750 Beverly St E
- 2750 Beverly St
- 2753 Beverly St
- 1353 E Claybourne Ave
- 2753 S Beverly St
- 2742 Beverly St
- 2742 S Beverly St
- 1349 E Claybourne Ave
- 1389 E Claybourne Ave
- 2776 Beverly St
- 2736 S Beverly St
- 1358 E Claybourne Ave
- 2736 Beverly St
- 2741 Beverly St
- 1354 E Claybourne Ave
- 2741 S Alden St
- 1350 E Claybourne Ave
- 2771 S Beverly St
- 1343 E Claybourne Ave