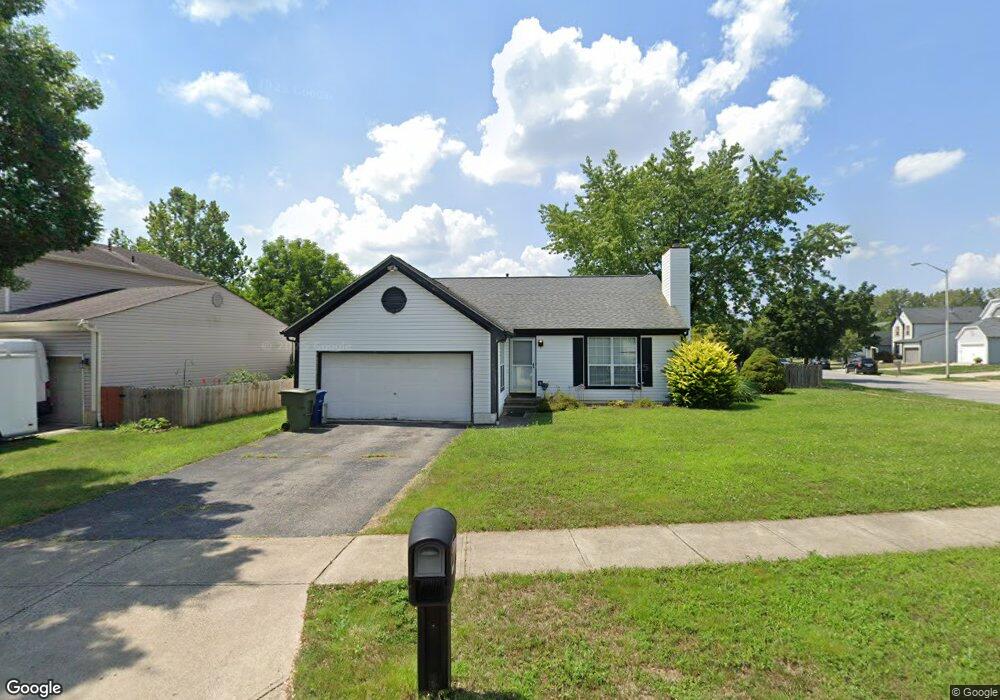
1363 Restwood Ct Columbus, OH 43204
Brookshire NeighborhoodEstimated Value: $249,000 - $262,000
3
Beds
2
Baths
1,152
Sq Ft
$223/Sq Ft
Est. Value
About This Home
This home is located at 1363 Restwood Ct, Columbus, OH 43204 and is currently estimated at $257,396, approximately $223 per square foot. 1363 Restwood Ct is a home located in Franklin County with nearby schools including West Franklin Elementary School, Franklin Woods Intermediate School, and Finland Middle School.
Ownership History
Date
Name
Owned For
Owner Type
Purchase Details
Closed on
Nov 16, 1995
Sold by
S A R Const Co
Bought by
Myers Joseph A and Myers Lillian D
Current Estimated Value
Home Financials for this Owner
Home Financials are based on the most recent Mortgage that was taken out on this home.
Original Mortgage
$99,320
Outstanding Balance
$700
Interest Rate
7.65%
Mortgage Type
FHA
Estimated Equity
$256,696
Purchase Details
Closed on
Mar 14, 1995
Sold by
Homewood Corp
Bought by
Sculie Properties Ltd Ptns
Create a Home Valuation Report for This Property
The Home Valuation Report is an in-depth analysis detailing your home's value as well as a comparison with similar homes in the area
Home Values in the Area
Average Home Value in this Area
Purchase History
| Date | Buyer | Sale Price | Title Company |
|---|---|---|---|
| Myers Joseph A | $101,722 | -- | |
| Sculie Properties Ltd Ptns | $15,500 | -- |
Source: Public Records
Mortgage History
| Date | Status | Borrower | Loan Amount |
|---|---|---|---|
| Open | Myers Joseph A | $99,320 |
Source: Public Records
Tax History Compared to Growth
Tax History
| Year | Tax Paid | Tax Assessment Tax Assessment Total Assessment is a certain percentage of the fair market value that is determined by local assessors to be the total taxable value of land and additions on the property. | Land | Improvement |
|---|---|---|---|---|
| 2024 | $2,551 | $69,970 | $23,350 | $46,620 |
| 2023 | $2,506 | $69,965 | $23,345 | $46,620 |
| 2022 | $2,306 | $47,250 | $8,400 | $38,850 |
| 2021 | $2,352 | $47,250 | $8,400 | $38,850 |
| 2020 | $2,339 | $47,250 | $8,400 | $38,850 |
| 2019 | $2,191 | $39,060 | $7,000 | $32,060 |
| 2018 | $2,084 | $39,060 | $7,000 | $32,060 |
| 2017 | $2,079 | $39,060 | $7,000 | $32,060 |
| 2016 | $1,986 | $32,830 | $7,140 | $25,690 |
| 2015 | $1,986 | $32,830 | $7,140 | $25,690 |
| 2014 | $1,988 | $32,830 | $7,140 | $25,690 |
| 2013 | $1,096 | $36,470 | $7,945 | $28,525 |
Source: Public Records
Map
Nearby Homes
- 1465 Tall Meadows Dr
- 1181 Onslow Dr
- 1226 Pinnacle Dr
- 2987 Daisy Ln
- 1027 S Brinker Ave
- 1657 Ripplebrook Rd
- 3360 Briggs Rd
- 1248 Gresham Rd
- 3326 Bluhm Ct
- 1037 Chestershire Rd
- 2929 Briggs Rd
- 1520 Fall Brook Rd
- 3318 Miriam Dr S
- 1485 Demorest Rd
- 3728 Greenock Ct
- 2856 Chesfield Dr
- 3029 Rosedale Ave
- 3551 Glorious Rd
- 840 Mark Place
- 894 Binns Blvd
- 1371 Restwood Ct
- 1354 Emeline Ct
- 1379 Restwood Ct
- 1360 Emeline Ct
- 1360 Emeline Dr
- 3338 Emeline Dr
- 1331 Onslow Dr
- 1366 Emeline Ct
- 3344 Emeline Dr
- 1370 Restwood Ct
- 1336 Onslow Dr
- 1376 Restwood Ct
- 1382 Restwood Ct
- 1387 Restwood Ct
- 1325 Onslow Dr
- 3350 Emeline Dr
- 1388 Restwood Ct
- 3356 Emeline Dr
- 1328 Onslow Dr
- 1372 Emeline Ct