Estimated Value: $160,000 - $218,000
3
Beds
1
Bath
1,448
Sq Ft
$136/Sq Ft
Est. Value
About This Home
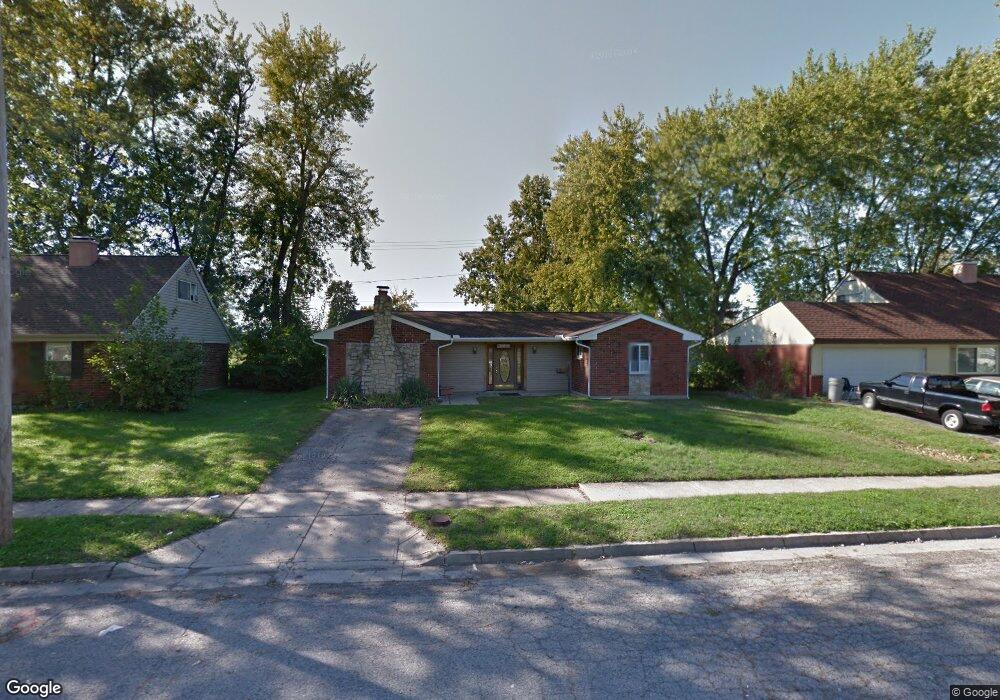
This home is located at 1364 Seneca Dr, Xenia, OH 45385 and is currently estimated at $197,602, approximately $136 per square foot. 1364 Seneca Dr is a home located in Greene County with nearby schools including Xenia High School, Summit Academy Community School for Alternative Learners - Xenia, and Legacy Christian Academy.
Ownership History
Date
Name
Owned For
Owner Type
Purchase Details
Closed on
Aug 10, 2018
Sold by
Johnson Rhonda L and Brown Rhonda L
Bought by
Johnson Rhonda L and Johnson James
Current Estimated Value
Purchase Details
Closed on
Sep 9, 2015
Sold by
Penix Daniel M
Bought by
Brown Rhonda L
Home Financials for this Owner
Home Financials are based on the most recent Mortgage that was taken out on this home.
Original Mortgage
$71,677
Outstanding Balance
$57,166
Interest Rate
4.37%
Mortgage Type
FHA
Estimated Equity
$140,436
Purchase Details
Closed on
May 18, 2005
Sold by
Penix Daniel M
Bought by
Penix Daniel M and Penix Sue A
Purchase Details
Closed on
Sep 23, 1994
Sold by
Tonne William R
Bought by
Penix Daniel M
Home Financials for this Owner
Home Financials are based on the most recent Mortgage that was taken out on this home.
Original Mortgage
$62,014
Interest Rate
8.62%
Mortgage Type
FHA
Create a Home Valuation Report for This Property
The Home Valuation Report is an in-depth analysis detailing your home's value as well as a comparison with similar homes in the area
Home Values in the Area
Average Home Value in this Area
Purchase History
| Date | Buyer | Sale Price | Title Company |
|---|---|---|---|
| Johnson Rhonda L | -- | None Available | |
| Brown Rhonda L | $73,000 | Box Buckeye Title | |
| Penix Daniel M | -- | -- | |
| Penix Daniel M | $62,900 | -- |
Source: Public Records
Mortgage History
| Date | Status | Borrower | Loan Amount |
|---|---|---|---|
| Open | Brown Rhonda L | $71,677 | |
| Previous Owner | Penix Daniel M | $62,014 |
Source: Public Records
Tax History
| Year | Tax Paid | Tax Assessment Tax Assessment Total Assessment is a certain percentage of the fair market value that is determined by local assessors to be the total taxable value of land and additions on the property. | Land | Improvement |
|---|---|---|---|---|
| 2024 | $2,156 | $50,760 | $11,610 | $39,150 |
| 2023 | $2,117 | $50,760 | $11,610 | $39,150 |
| 2022 | $1,764 | $36,070 | $6,830 | $29,240 |
| 2021 | $1,788 | $36,070 | $6,830 | $29,240 |
| 2020 | $1,711 | $36,070 | $6,830 | $29,240 |
| 2019 | $1,436 | $28,490 | $6,560 | $21,930 |
| 2018 | $1,480 | $28,490 | $6,560 | $21,930 |
| 2017 | $1,346 | $28,490 | $6,560 | $21,930 |
| 2016 | $1,347 | $25,440 | $6,560 | $18,880 |
| 2015 | $1,315 | $25,440 | $6,560 | $18,880 |
| 2014 | $1,258 | $25,440 | $6,560 | $18,880 |
Source: Public Records
Map
Nearby Homes
- 1777 Kylemore Dr
- 161 Montana Dr
- 1874 Pennsylvania Dr
- 219 Kansas Dr
- 1715 Sioux Dr
- 310 Tranquil Dr
- 1778 Arapaho Dr
- 1528 June Dr
- 2208 Harmony Dr
- 1272 Bellbrook Ave
- 624 Georgia Dr
- 1010 Bellbrook Ave
- 2265 Virginia Dr
- 2149 Cornwall Dr
- 1351 Omard Dr
- 1321 Massachusetts Dr
- 2499 Jenny Marie Dr
- 1001 Glen Kegley Dr
- 883 Omard Dr
- 0 Berkshire Dr Unit 949217
- 1376 Seneca Dr
- 1350 Seneca Dr
- 1396 Seneca Dr
- 1342 Seneca Dr
- 1349 Seneca Dr
- 1385 Seneca Dr
- 1402 Seneca Dr
- 1334 Seneca Dr
- 805 Upper Bellbrook Rd
- 1594 Cheyenne Dr
- 1591 Cheyenne Dr
- 1416 Seneca Dr
- 1341 Seneca Dr
- 1341 Seneca Dr Unit 1343
- 1341 Seneca Dr Unit 1341-1343
- 1326 Seneca Dr
- 1415 Seneca Dr
- 1580 Cheyenne Dr
- 1402 Oshaughnesy Dr
- 1430 Seneca Dr
Your Personal Tour Guide
Ask me questions while you tour the home.