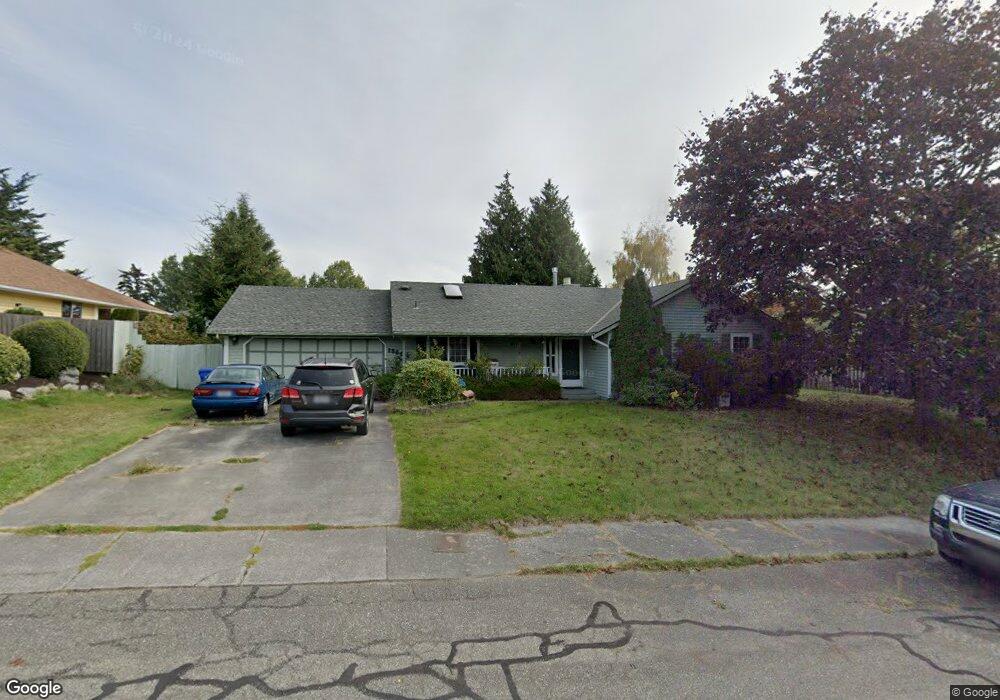
1364 SW Looking Glass Loop Oak Harbor, WA 98277
Estimated Value: $440,972 - $473,000
3
Beds
2
Baths
1,248
Sq Ft
$371/Sq Ft
Est. Value
About This Home
This home is located at 1364 SW Looking Glass Loop, Oak Harbor, WA 98277 and is currently estimated at $462,743, approximately $370 per square foot. 1364 SW Looking Glass Loop is a home located in Island County with nearby schools including Broadview Elementary School, Oak Harbor Middle School, and Oak Harbor High School.
Ownership History
Date
Name
Owned For
Owner Type
Purchase Details
Closed on
Oct 22, 2024
Sold by
Colleen Parhaniemi Living Trust and Mcallaster Jay Loring
Bought by
Mcallaster Jay Loring
Current Estimated Value
Purchase Details
Closed on
Jul 19, 2021
Sold by
Parhaniemi Colleen
Bought by
Parhaniemi Colleen D and Colleen Parhaniemi Liv Tr
Purchase Details
Closed on
Mar 27, 2007
Sold by
Parhaniemi Rudolph L
Bought by
Parhaniemi Colleen
Purchase Details
Closed on
Jul 22, 2004
Sold by
Talbot Richard W and Talbot Amy C
Bought by
Moore Brian C and Moore Karla L
Home Financials for this Owner
Home Financials are based on the most recent Mortgage that was taken out on this home.
Original Mortgage
$196,795
Interest Rate
6.24%
Mortgage Type
VA
Create a Home Valuation Report for This Property
The Home Valuation Report is an in-depth analysis detailing your home's value as well as a comparison with similar homes in the area
Home Values in the Area
Average Home Value in this Area
Purchase History
| Date | Buyer | Sale Price | Title Company |
|---|---|---|---|
| Mcallaster Jay Loring | $313 | None Listed On Document | |
| Parhaniemi Colleen D | -- | None Available | |
| Parhaniemi Colleen | -- | Chicago Title Co Island Div | |
| Parhaniemi Colleen | $251,225 | Chicago Title Co Island Div | |
| Moore Brian C | $188,000 | Chicago Title Co Island Div |
Source: Public Records
Mortgage History
| Date | Status | Borrower | Loan Amount |
|---|---|---|---|
| Previous Owner | Moore Brian C | $196,795 |
Source: Public Records
Tax History Compared to Growth
Tax History
| Year | Tax Paid | Tax Assessment Tax Assessment Total Assessment is a certain percentage of the fair market value that is determined by local assessors to be the total taxable value of land and additions on the property. | Land | Improvement |
|---|---|---|---|---|
| 2025 | $3,619 | $428,959 | $200,000 | $228,959 |
| 2024 | $3,683 | $426,513 | $190,000 | $236,513 |
| 2023 | $3,683 | $436,513 | $200,000 | $236,513 |
| 2022 | $3,657 | $396,934 | $180,000 | $216,934 |
| 2021 | $3,078 | $341,059 | $150,000 | $191,059 |
| 2020 | $3,077 | $286,066 | $100,000 | $186,066 |
| 2019 | $2,638 | $283,035 | $150,000 | $133,035 |
| 2018 | $2,743 | $263,444 | $130,000 | $133,444 |
| 2017 | $2,381 | $241,459 | $110,000 | $131,459 |
| 2016 | $2,272 | $223,102 | $90,000 | $133,102 |
| 2015 | -- | $204,745 | $70,000 | $134,745 |
| 2013 | -- | $193,033 | $55,000 | $138,033 |
Source: Public Records
Map
Nearby Homes
- 1250 SW Heller Rd Unit C1
- 1250 SW Heller St Unit B2
- 1472 SW 10th Ave
- 1380 SW Swantown Ave
- 1121 SW Barrington Dr Unit 3
- 748 SW Heller St
- 1530 SW 16th Ave
- 942 SW Barrington Dr
- 1605 SW 16th Ave
- 1101 SW Harrier Cir Unit 106
- 660 SW Harrier Cir Unit 1
- 984 SW 6th Ave
- 1651 SW Mulberry Place Unit E204
- 1700 SW Mulberry Place Unit A302
- 1238 SW Lopez Dr
- 478 SW Judson Dr
- 1875 SW Sunnyside Ave
- 2029 Baymont Dr
- 915 SW Kimball Dr Unit B3
- 1827 SW Olive St
- 1388 SW Looking Glass Loop
- 1348 SW Looking Glass Loop
- 1265 SW Barrington Dr
- 1365 SW Looking Glass Loop
- 1349 SW Looking Glass Loop
- 1326 SW Looking Glass Loop
- 1387 SW Looking Glass Loop
- 1260 SW Looking Glass Loop
- 1243 SW Barrington Dr
- 1329 SW Looking Glass Loop
- 1242 SW Looking Glass Loop
- 980 SW McCrohan St
- 1326 SW Barrington Dr
- 1380 SW Barrington Dr
- 1319 SW Looking Glass Loop
- 951 SW McCrohan St
- 948 SW McCrohan St
- 1055 SW Heller St
- 1283 SW Looking Glass Loop