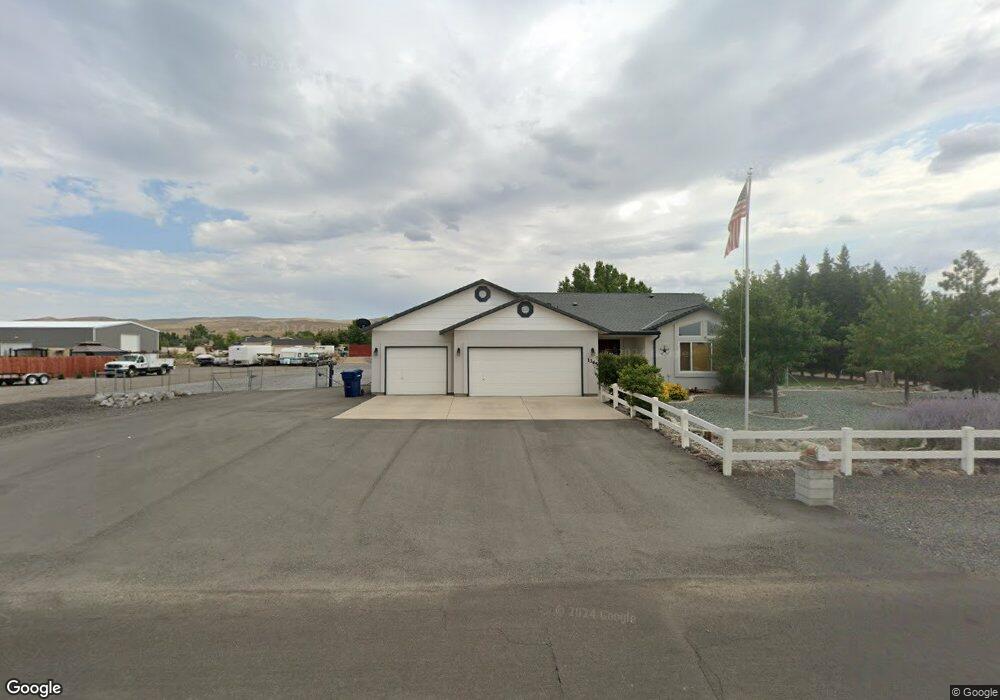
1365 Buckboard Way Fernley, NV 89408
Estimated Value: $505,000 - $763,449
3
Beds
2
Baths
1,777
Sq Ft
$357/Sq Ft
Est. Value
About This Home
This home is located at 1365 Buckboard Way, Fernley, NV 89408 and is currently estimated at $634,612, approximately $357 per square foot. 1365 Buckboard Way is a home located in Lyon County with nearby schools including Cottonwood Elementary School, Fernley Intermediate School, and Fernley High School.
Ownership History
Date
Name
Owned For
Owner Type
Purchase Details
Closed on
Feb 1, 2023
Sold by
Specchio Barbara D
Bought by
Specchio Joseph A
Current Estimated Value
Home Financials for this Owner
Home Financials are based on the most recent Mortgage that was taken out on this home.
Original Mortgage
$217,000
Outstanding Balance
$210,117
Interest Rate
6.27%
Mortgage Type
New Conventional
Estimated Equity
$424,495
Purchase Details
Closed on
Sep 6, 2012
Sold by
Specchio Joseph A and Specchio Barbara D
Bought by
Specchio Barbara D and Specchio Joseph A
Home Financials for this Owner
Home Financials are based on the most recent Mortgage that was taken out on this home.
Original Mortgage
$229,980
Interest Rate
3.5%
Purchase Details
Closed on
May 6, 2005
Sold by
Specchio Barbara D and Rush Barbara D
Bought by
Specchio Joseph A and Specchio Barbara D
Create a Home Valuation Report for This Property
The Home Valuation Report is an in-depth analysis detailing your home's value as well as a comparison with similar homes in the area
Home Values in the Area
Average Home Value in this Area
Purchase History
| Date | Buyer | Sale Price | Title Company |
|---|---|---|---|
| Specchio Joseph A | -- | Stewart Title Company | |
| Specchio Barbara D | -- | Title Service & Escrow Co Fe | |
| Specchio Joseph A | -- | Accommodation |
Source: Public Records
Mortgage History
| Date | Status | Borrower | Loan Amount |
|---|---|---|---|
| Open | Specchio Joseph A | $217,000 | |
| Previous Owner | Specchio Barbara D | $229,980 |
Source: Public Records
Tax History Compared to Growth
Tax History
| Year | Tax Paid | Tax Assessment Tax Assessment Total Assessment is a certain percentage of the fair market value that is determined by local assessors to be the total taxable value of land and additions on the property. | Land | Improvement |
|---|---|---|---|---|
| 2025 | $2,873 | $160,909 | $63,000 | $97,909 |
| 2024 | $3,199 | $162,147 | $63,000 | $99,146 |
| 2023 | $3,199 | $155,492 | $63,000 | $92,492 |
| 2022 | $2,994 | $146,461 | $63,000 | $83,461 |
| 2021 | $2,943 | $138,271 | $56,000 | $82,271 |
| 2020 | $2,865 | $136,077 | $56,000 | $80,077 |
| 2019 | $2,809 | $123,464 | $43,750 | $79,714 |
| 2018 | $2,440 | $113,148 | $43,750 | $69,398 |
| 2017 | $2,414 | $104,491 | $35,000 | $69,491 |
| 2016 | $2,208 | $82,760 | $11,550 | $71,210 |
| 2015 | $2,241 | $67,960 | $11,550 | $56,410 |
| 2014 | $2,187 | $66,681 | $11,550 | $55,131 |
Source: Public Records
Map
Nearby Homes
- 1405 Buckboard Way
- 2605 Emerson Cir
- 1240-1250 Farm District Rd
- 1285 Camille Dr
- 1165 Farm Ln
- 1165 Jenny's Ln
- 675 Warren Way
- 1671 Vista Moon Ct
- 698 Jenny's Ln
- 870 Jennys Ln
- 1563 Maria Ct
- 863 Jennys Ln
- 1409 Jennys Ln
- 1740 Johns Cir
- 636 Brook Ln
- 1505 Wrangler Ln
- 1494 Mountain Rose Dr
- 1411 Shadow Ln
- 1300 Rancho Rd
- 1625 Picetti Way
- 1345 Buckboard Way
- 1385 Buckboard Way
- 1090 Cejay Way
- 1380 Buckboard Way
- 1405 Buck Board Way
- 1150 Whipple Tree Ln
- 1325 Buckboard Way
- 1320 Buckboard Way
- 1145 Whipple Tree Ln
- 1400 Buckboard Way
- 1060 Cejay Way
- 1160 Whipple Tree Ln
- 905 Madison Creek Dr
- 1305 Buckboard Way
- 1425 Buckboard Way
- 1155 Whipple Tree Ln
- 1300 Buckboard Way
- 1125 Camille Dr
- 1065 Cejay Way
- 900 Madison Creek Dr