Estimated Value: $652,000 - $783,000
3
Beds
2
Baths
1,699
Sq Ft
$413/Sq Ft
Est. Value
About This Home
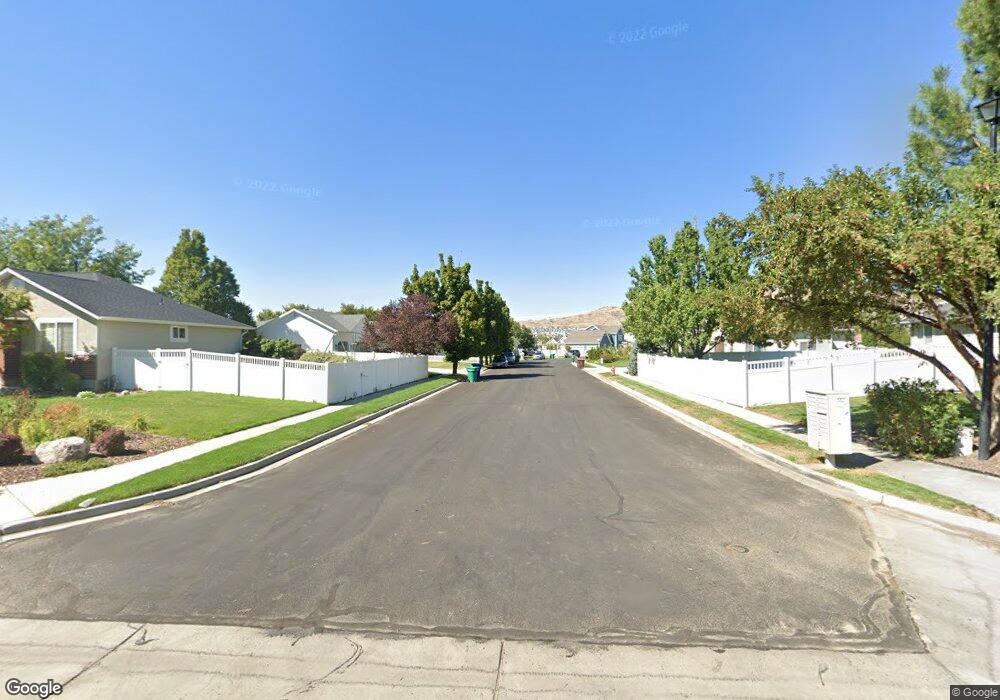
This home is located at 1365 E 2500 N, Lehi, UT 84043 and is currently estimated at $702,253, approximately $413 per square foot. 1365 E 2500 N is a home located in Utah County with nearby schools including Freedom Elementary School, Lehi Junior High School, and Skyridge High School.
Ownership History
Date
Name
Owned For
Owner Type
Purchase Details
Closed on
Mar 4, 2003
Sold by
N & B Evans Second Family Lp
Bought by
Greenwood Michael R and Greenwood Jill B
Current Estimated Value
Home Financials for this Owner
Home Financials are based on the most recent Mortgage that was taken out on this home.
Original Mortgage
$70,000
Outstanding Balance
$30,203
Interest Rate
5.93%
Mortgage Type
Seller Take Back
Estimated Equity
$672,050
Purchase Details
Closed on
Apr 17, 2001
Sold by
Evans Barbara H and Evans Neal B
Bought by
N & B Evans Second Family Ltd Prtnrshp
Purchase Details
Closed on
Nov 5, 2000
Sold by
Patterson Construction Inc
Bought by
Evans Barbara H and Evans Neal B
Home Financials for this Owner
Home Financials are based on the most recent Mortgage that was taken out on this home.
Original Mortgage
$8,000
Interest Rate
7.66%
Mortgage Type
Seller Take Back
Create a Home Valuation Report for This Property
The Home Valuation Report is an in-depth analysis detailing your home's value as well as a comparison with similar homes in the area
Home Values in the Area
Average Home Value in this Area
Purchase History
| Date | Buyer | Sale Price | Title Company |
|---|---|---|---|
| Greenwood Michael R | -- | Signature Title | |
| N & B Evans Second Family Ltd Prtnrshp | -- | -- | |
| Evans Barbara H | -- | Signature Title Ins Agency I |
Source: Public Records
Mortgage History
| Date | Status | Borrower | Loan Amount |
|---|---|---|---|
| Open | Greenwood Michael R | $70,000 | |
| Previous Owner | Evans Barbara H | $8,000 |
Source: Public Records
Tax History Compared to Growth
Tax History
| Year | Tax Paid | Tax Assessment Tax Assessment Total Assessment is a certain percentage of the fair market value that is determined by local assessors to be the total taxable value of land and additions on the property. | Land | Improvement |
|---|---|---|---|---|
| 2025 | $2,566 | $333,080 | $232,400 | $373,200 |
| 2024 | $2,566 | $300,245 | $0 | $0 |
| 2023 | $2,410 | $306,185 | $0 | $0 |
| 2022 | $2,595 | $319,660 | $0 | $0 |
| 2021 | $2,324 | $432,800 | $134,500 | $298,300 |
| 2020 | $2,191 | $403,300 | $124,500 | $278,800 |
| 2019 | $1,917 | $366,900 | $124,500 | $242,400 |
| 2018 | $1,834 | $331,800 | $119,100 | $212,700 |
| 2017 | $1,788 | $171,930 | $0 | $0 |
| 2016 | $1,832 | $163,460 | $0 | $0 |
| 2015 | -- | $157,630 | $0 | $0 |
| 2014 | $1,793 | $150,975 | $0 | $0 |
Source: Public Records
Map
Nearby Homes
- 975 E 2850 N
- 975 E 2125 N
- 2208 N 825 E
- 859 E 2125 N
- 1602 E Center Pointe Dr
- 1602 E Center Pointe Dr Unit 1
- 1610 E Center Pointe Dr
- 9967 N 6670 W
- 9924 N 6630 W Unit 9
- 6692 W 9770 N
- 10434 N 6400 W
- 3368 N 700 E
- 6399 W 10150 N
- 6373 W 10500 N
- 6372 W 10400 N
- 2539 N 300 E
- 192 E 2200 N
- 629 E 3420 N
- 565 E 3375 N
- 292 E Clubview Ln